-
Battery, EV
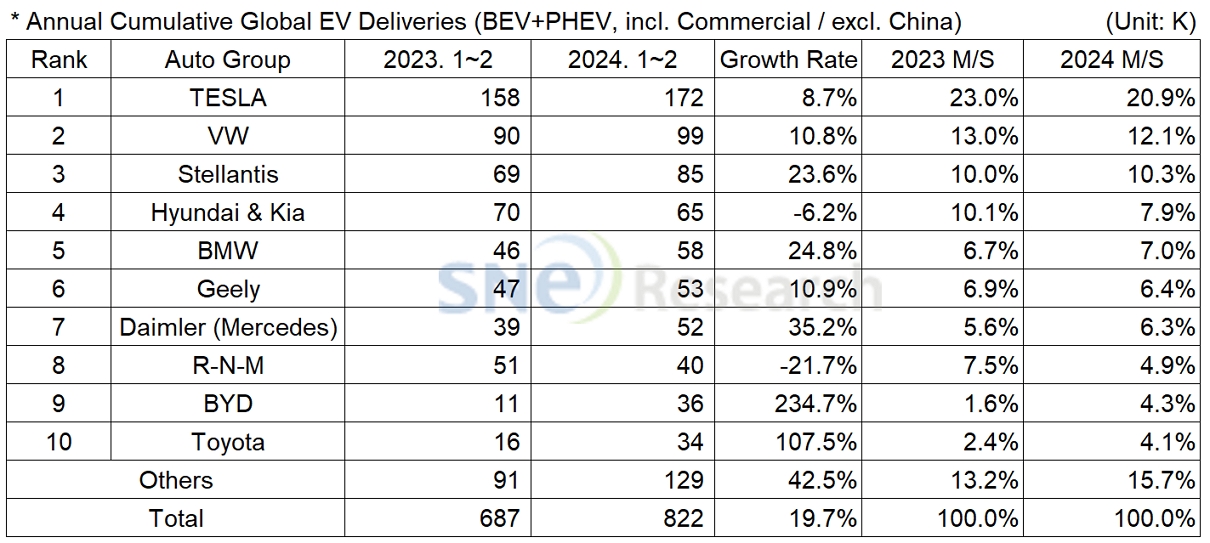
From Jan to Feb in 2024, Non-China Global Electric Vehicle Deliveries Posted 822k units, a 19.7% YoY Growth
2024.04.11 -
Battery, EV
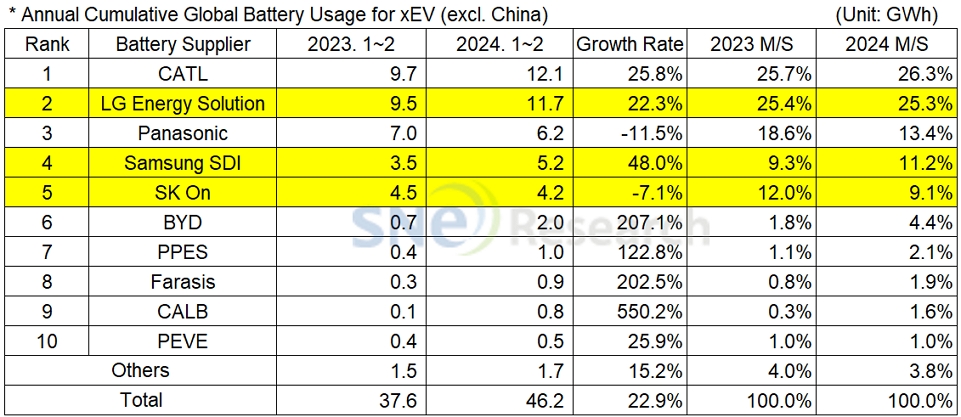
From Jan to Feb 2024, Non-Chinese Global EV Battery Usage Posted 46.2GWh, a 22.9% YoY Growth
2024.04.10 -
Battery, EV
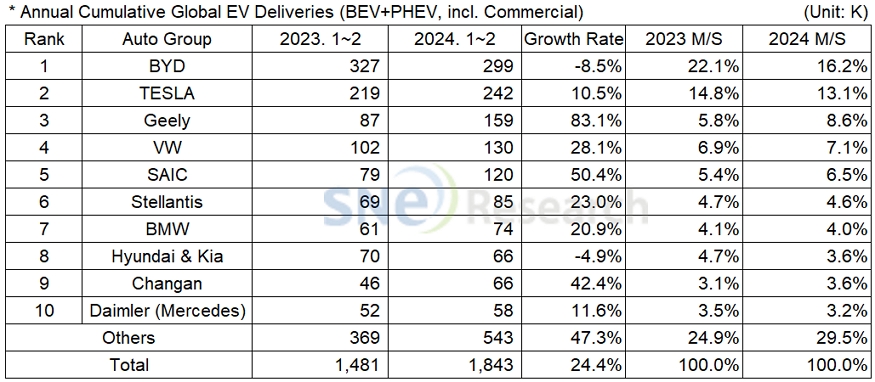
From Jan to Feb 2024, Global Electric Vehicle Deliveries Posted Approx. 1.843 Mil Units, a 24.4% YoY Growth
2024.04.09 -
Battery, EV
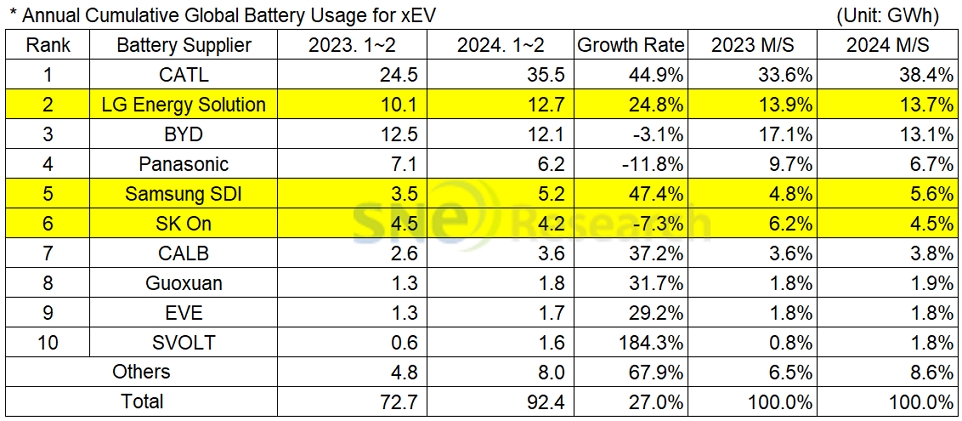
From Jan to Feb 2024, Global EV Battery Usage Posted 92.4GWh, a 27.0% YoY Growth
2024.04.08 -
Battery, Battery Materials
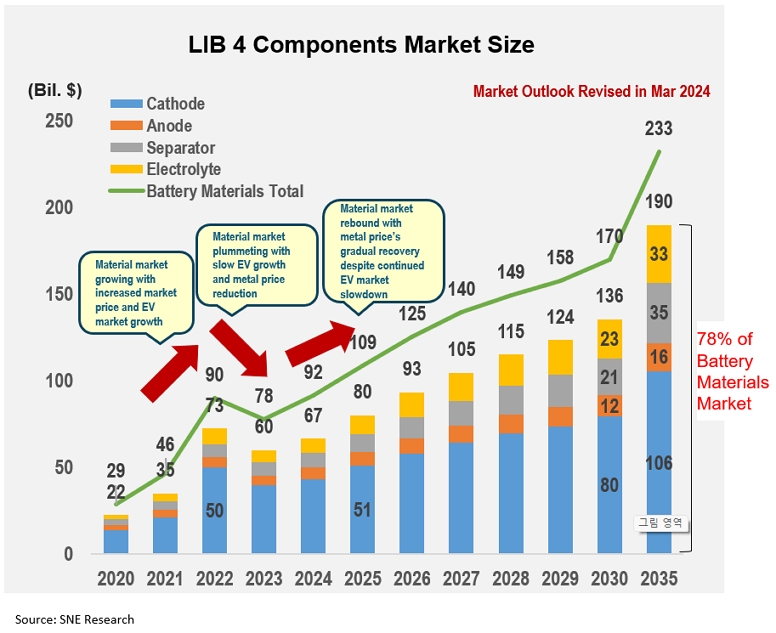
LIB 4 Components Market Saw 17% of Degrowth in 2023, Despite 33% Growth in EV Market
2024.03.15 -
Battery, EV
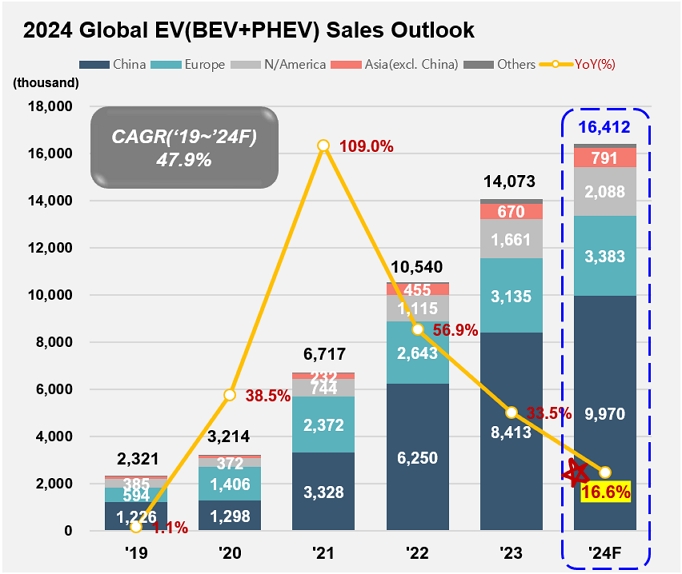
2024 Global EV Market Expected to See Sales of 16.4 million Units, 16.6% YoY Growth
2024.03.14 -
Battery, Energy Storage System
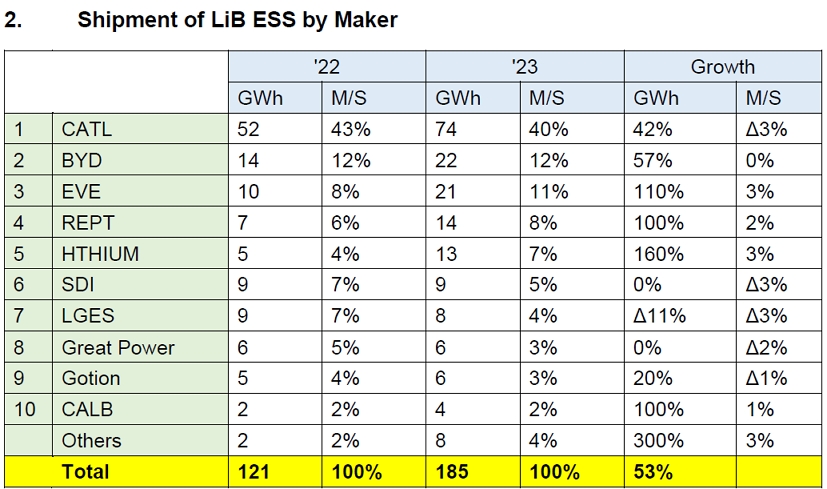
Global LiB for ESS Sales in 2023
2024.03.11 -
Battery, EV
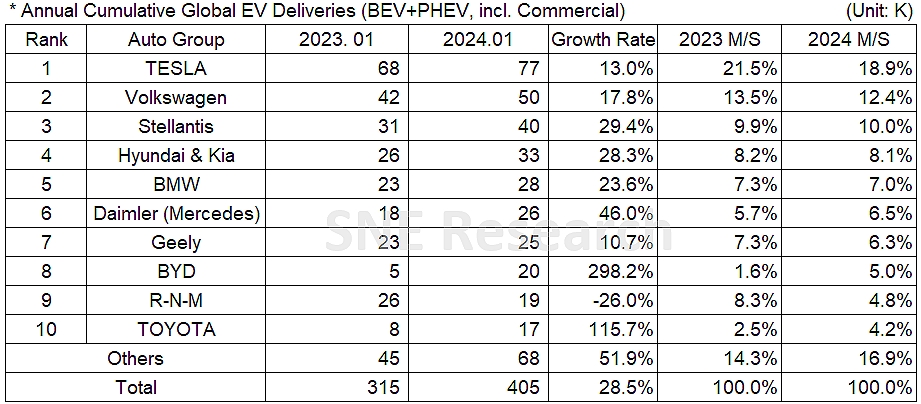
In January 2024, Non-China Global Electric Vehicle Deliveries Posted 405k units, a 28.5% YoY Growth
2024.03.11 -
Battery, EV
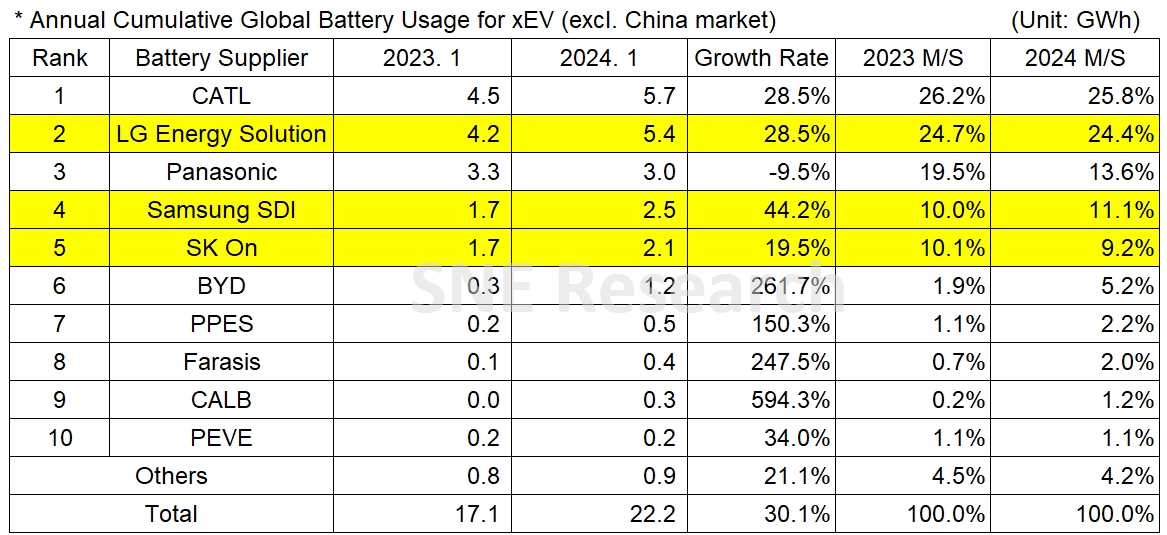
In January 2024, Non-Chinese Global EV Battery Usage Posted 22.2GWh, a 30.1% YoY Growth
2024.03.08 -
Battery, EV
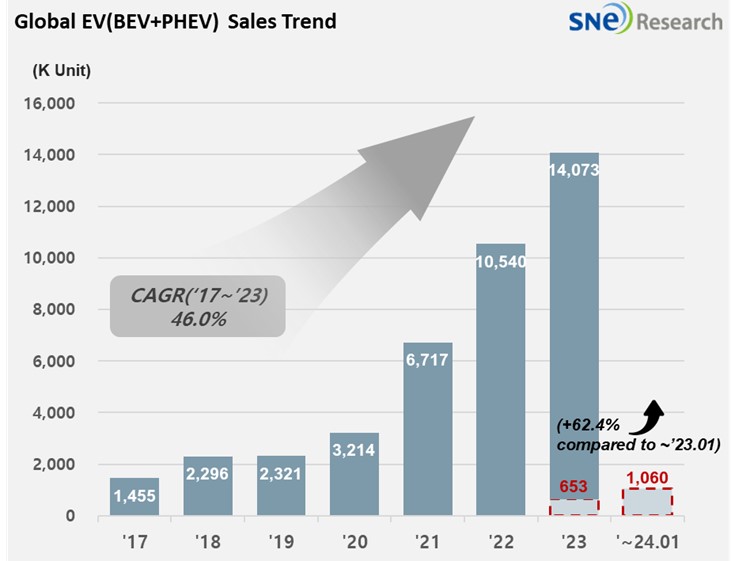
In January 2024, Global Electric Vehicle Deliveries Posted 1.060 Mil Units, a 62.4% YoY Growth
2024.03.07 -
Battery, EV
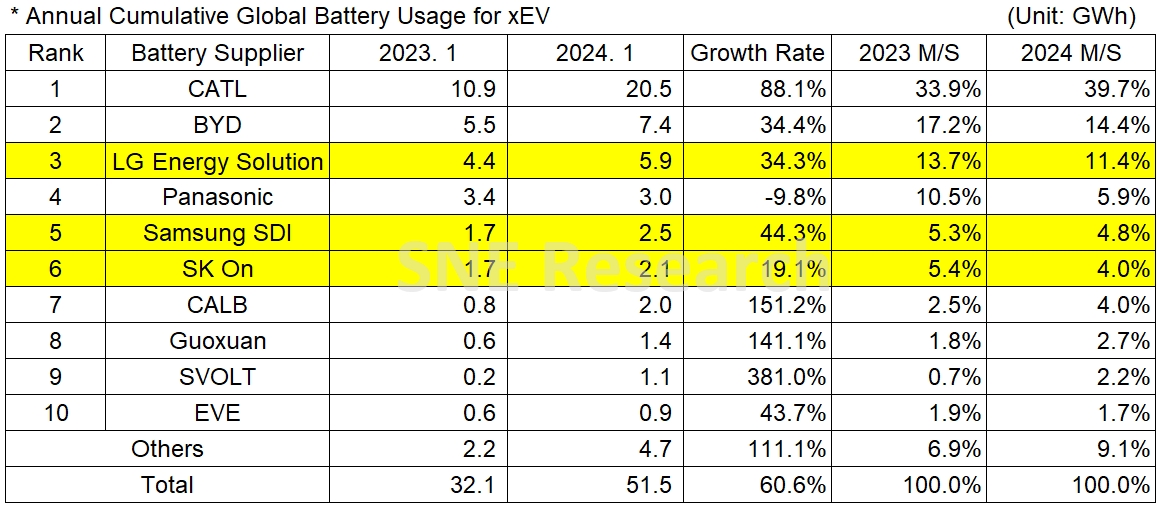
In January 2024, Global EV Battery Usage Posted 51.5GWh, a 60.6% YoY Growth
2024.03.06 -
Battery, Battery Materials
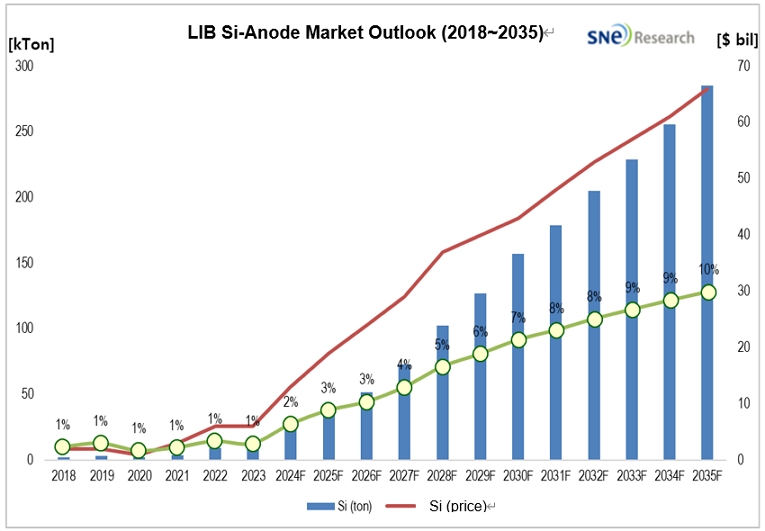
In 2035, LIB Si-Anode Market Expected to Grow at a CAGR of 39%, Reaching 285k ton (USD 6.6 Bil)
2024.02.23
Read news articles carefully picked by our professional analysts and get the most up-to-date market insight.
New Press
Battery, Battery Materials, EV
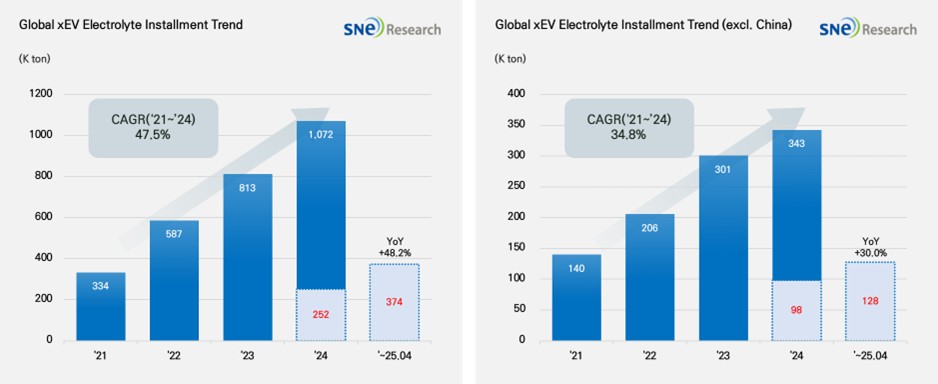
From Jan to Apr in 2025, Global Electric Vehicle Battery Electrolyte Installment Recorded 374K ton
From Jan to Apr in 2025, Global[1] Electric
Vehicle Battery Electrolyte Installment[2] Recorded
374K ton, a 48.2% YoY Growth- From Jan to Apr in 2025, the electrolyte market
continued to post a double-digit growth, while the non-China market showed a stable
expansion in demand.(Source: 2025 May Global EV & Battery Monthly Tracker (Incl. LiB 4 Major Materials), SNE Research) From Jan to Apr in 2025, the total installment of electrolyte used in electric vehicles (EV, PHEV, HEV) regist
2025.06.16
Battery, Battery Materials, EV
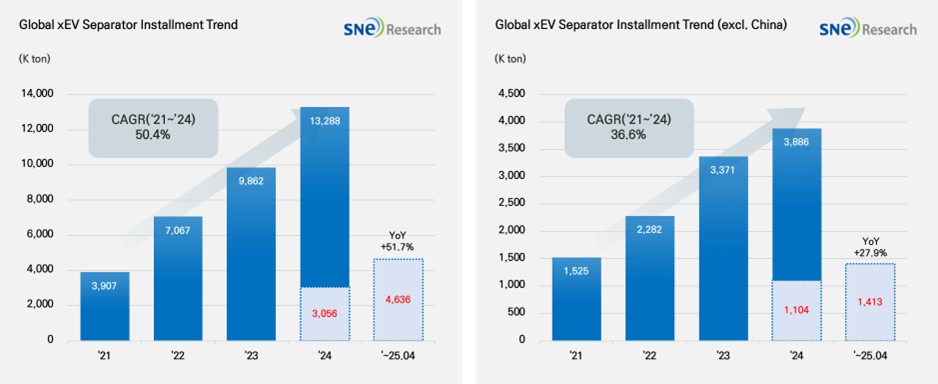
From Jan to Apr in 2025, Global Electric Vehicle Separator Installment Reached 4,636Mil ㎡
From Jan to
Apr in 2025, Global[1] Electric
Vehicle Separator Installment[2] Reached
4,636Mil ㎡, a 51.7% YoY Growth- From Jan to Apr in 2025, the global separator market posted
a steady growth due to the increasing installment of batteries in electric
vehicles.(Source: 2025 May Global EV & Battery Monthly Tracker (Incl. LiB 4 Major Materials), SNE Research) From Jan to Apr in 2025, the total installment of separator materials used in electric vehicles (EV, PHEV, HEV) registered w
2025.06.13
Battery, Battery Materials, EV
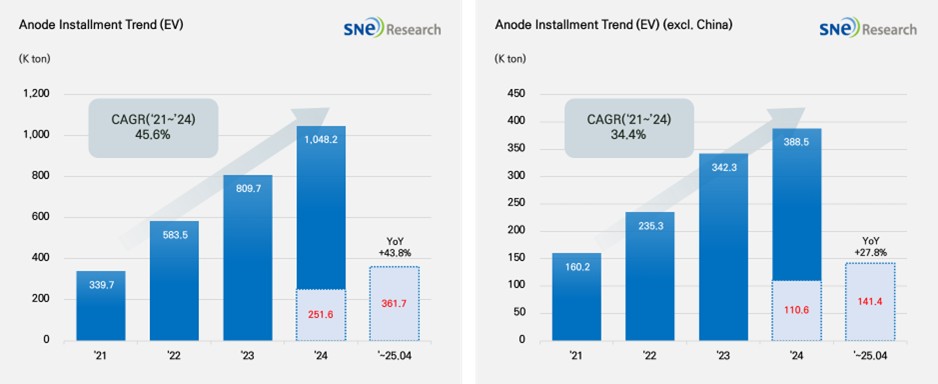
From Jan to Apr in 2025, Global Electric Vehicle Battery Anode Material Installment Reached 361.7K ton, a 43.8% YoY Growth
From Jan to Apr in 2025, Global[1] Electric
Vehicle Battery Anode Material Installment[2] Reached
361.7K ton, a 43.8% YoY Growth- The non-China
market recorded 141.4K ton, posting a 27.8% growth.(Source: 2025 May Global EV & Battery Monthly Tracker (Incl. LiB 4 Major Materials), SNE Research) From Jan to Apr in 2025, the total installment of anode materials used in electric vehicles (EV, PHEV, HEV) registered worldwide was approximately 361.7K ton, posting a 43.8% YoY growth and m
2025.06.12
Battery, Battery Materials, EV
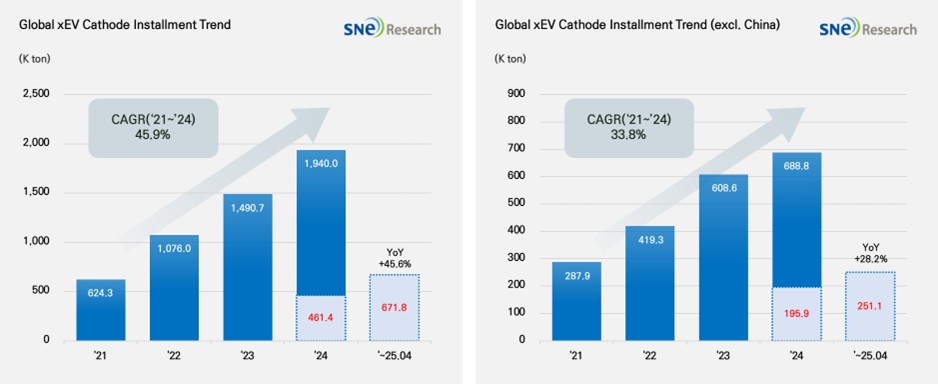
From Jan to Apr in 2025, Global Electric Vehicle Battery Cathode Material Installment Reached 671.8K ton
From Jan to Apr in 2025, Global[1] Electric
Vehicle Battery Cathode Material Installment [2] Reached
671.8K ton, a 45.6% YoY Growth- From Jan to Apr in 2025, EV battery
cathode material installment in non-China market was 251.1K ton, posting 28.2% growth(Source: 2025 May Global EV & Battery Monthly Tracker (Incl. LiB 4 Major Materials), SNE Research) From Jan to Apr in 2025, the total installment of cathode materials used in electric vehicles (EV, PHEV, HEV) registered worldwide was
2025.06.11
Battery, EV
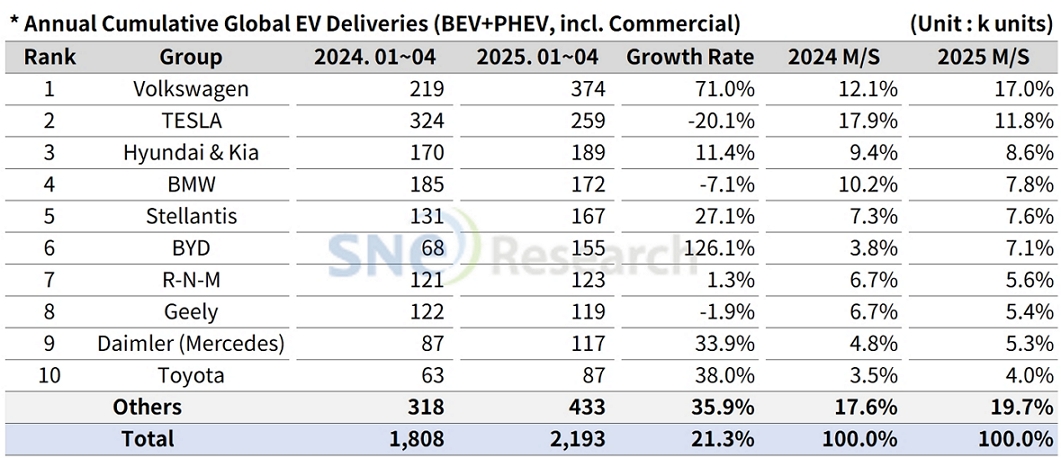
From Jan to Apr in 2025, Non-China Global Electric Vehicle Deliveries Recorded About 2.193 Mil Units
From Jan to Apr in 2025, Non-China
Global[1]
Electric Vehicle Deliveries[2]
Recorded About 2.193 Mil Units, a 21.3% YoY Growth
- Tesla ranked 2nd due to the impact of declining
sales in Europe
From Jan to Arp in 2025, the total number of electric vehicles registered in countries around the
world except China was approx. 2.193 million
units, a 21.3% YoY increase. (Source: Global EV & Battery Monthly Tracker – May 2025, SNE Research) If we look at
2025.06.10