
-
Battery, EV
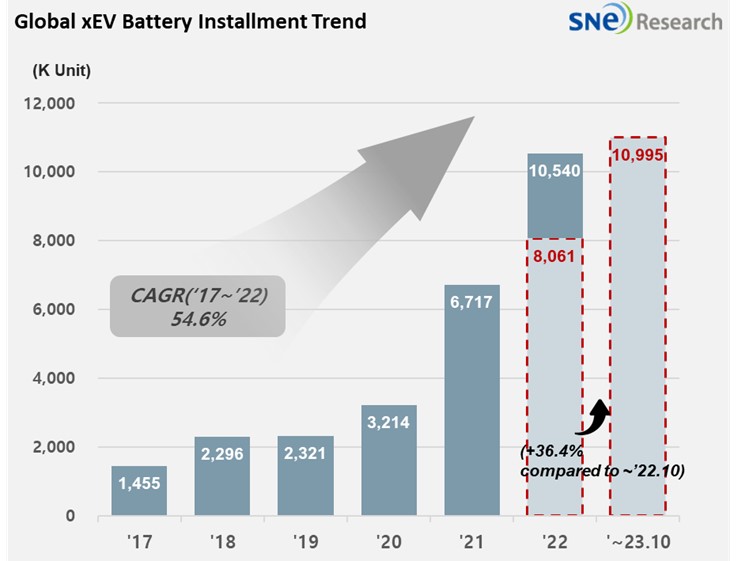
From Jan to Oct in 2023, Global Electric Vehicle Deliveries Posted 10.995 Mil Units, a 36.4% YoY growth
2023.12.07 -
Battery, EV
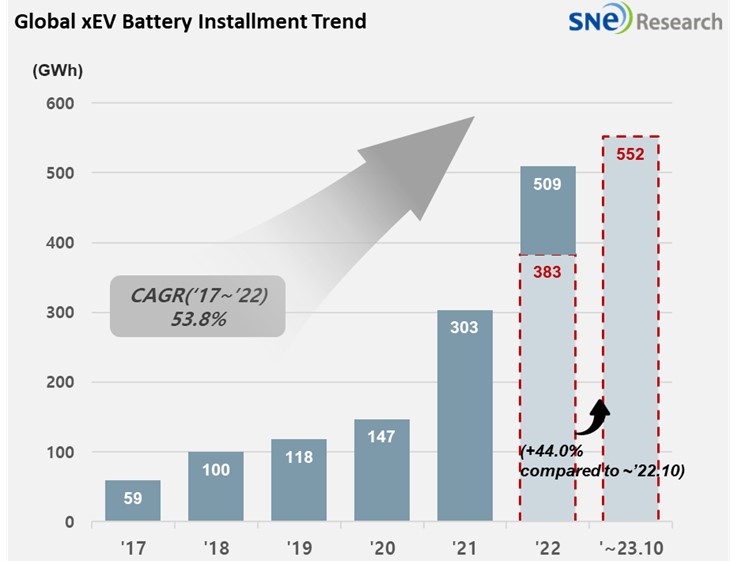
From Jan to Oct in 2023, Global EV Battery Usage Posted 552.2GWh, a 44.0% YoY Growth
2023.12.06 -
Battery, EV, Emerging Industry
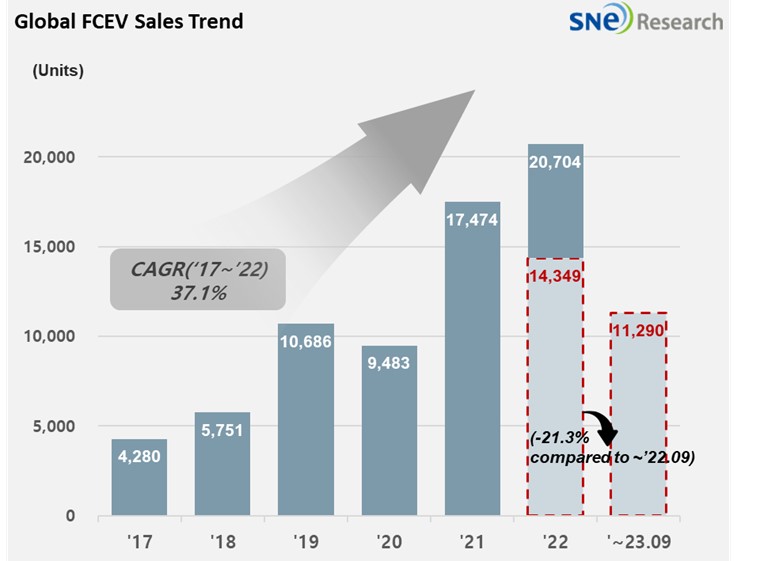
From Jan to September 2023, Global FCEV Market with a 21.3% YoY Degrowth
2023.11.20 -
Battery, EV
Global Electric Vehicle Deliveries in 2023 Expected to Record 13.77 Mil Units and a 30.6% YoY Growth, Leading to Possible Chance of Mild Downturn in EV Market
2023.11.16 -
Battery, EV
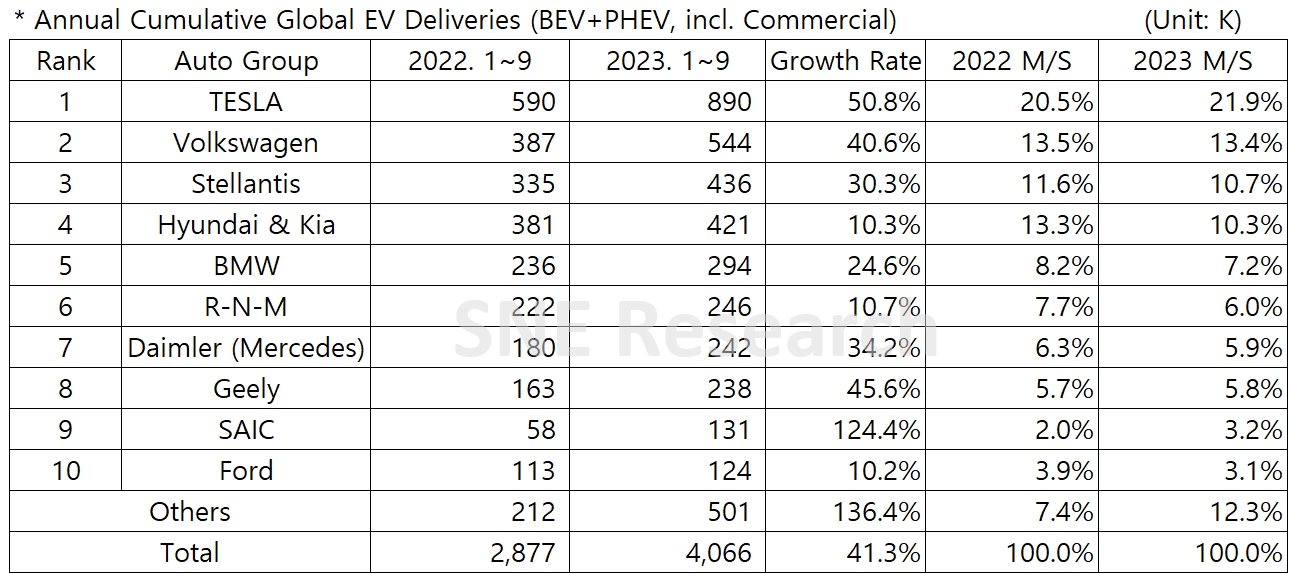
From Jan to Sep in 2023, Non-China Global Electric Vehicle Deliveries Posted 4.066 Mil Units, a 41.3% YoY Growth
2023.11.10 -
Battery, EV
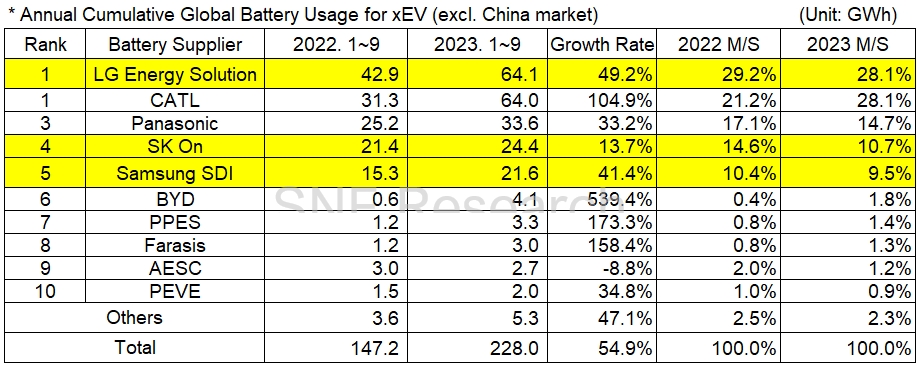
From Jan to September in 2023, Non-Chinese Global EV Battery Usage Posted 228.0GWh, a 54.9% YoY Growth
2023.11.09 -
Battery, EV
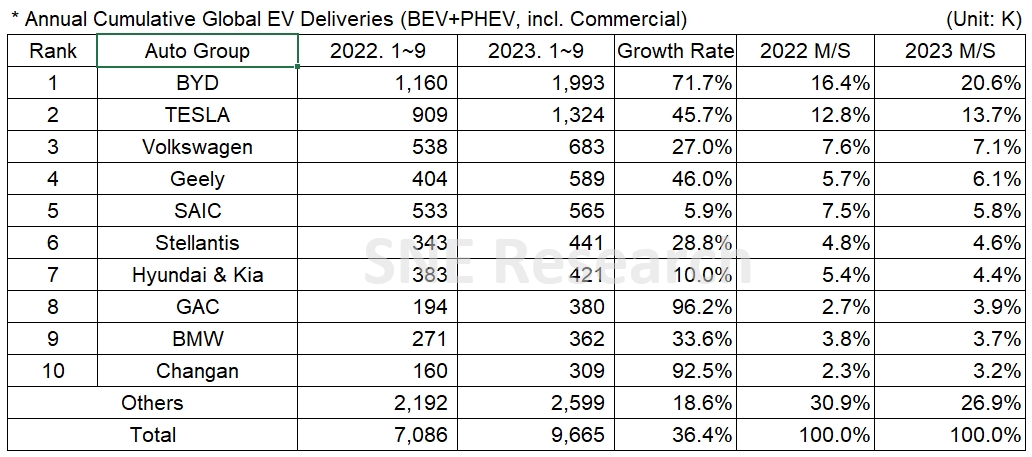
From Jan to Sep in 2023, Global Electric Vehicle Deliveries Posted 9.665 Mil Units , a 36.4% YoY Growth
2023.11.08 -
Battery, EV
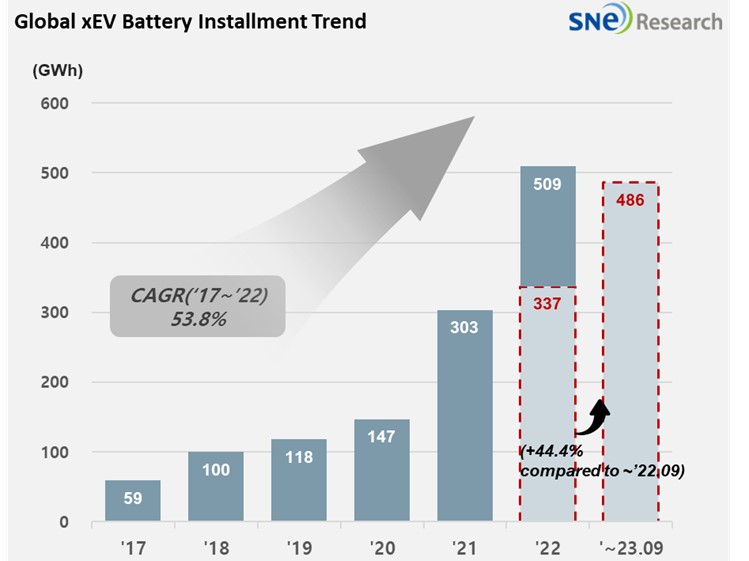
From Jan to Sep in 2023, Global EV Battery Usage Posted 485.9GWh , a 44.4% YoY Growth
2023.11.07 -
Battery, Emerging Industry
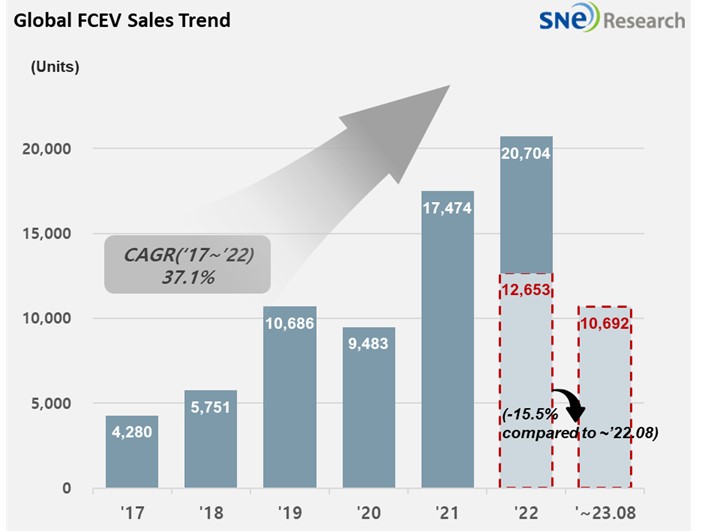
From Jan to August 2023, Global FCEV Market with a 15.5% YoY Degrowth
2023.10.17 -
Battery, EV
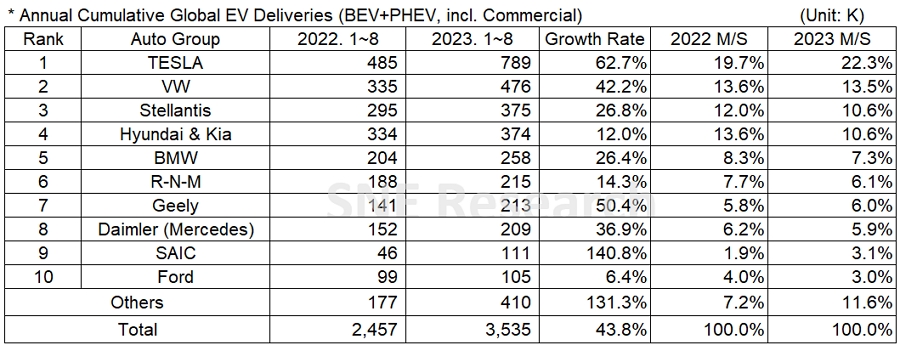
From Jan to Aug in 2023, Non-China Global Electric Vehicle Deliveries Recorded 3.535 Mil Units, a 43.8% YoY Growth
2023.10.16 -
Battery, EV
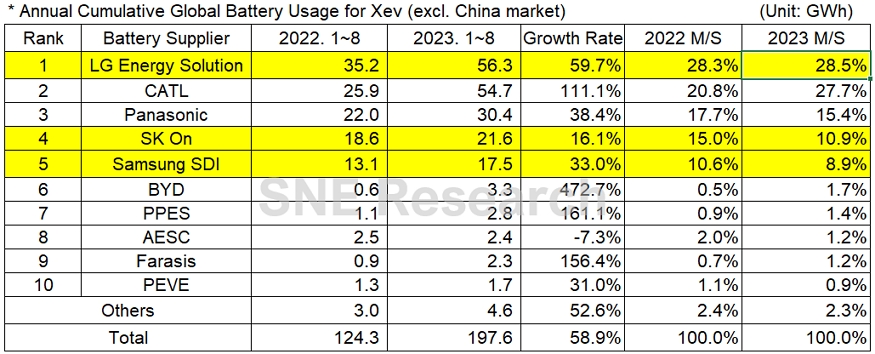
From Jan to August in 2023, Non-Chinese Global EV Battery Usage Posted 197.6GWh, a 58.9% YoY Growth
2023.10.13 -
Battery, EV
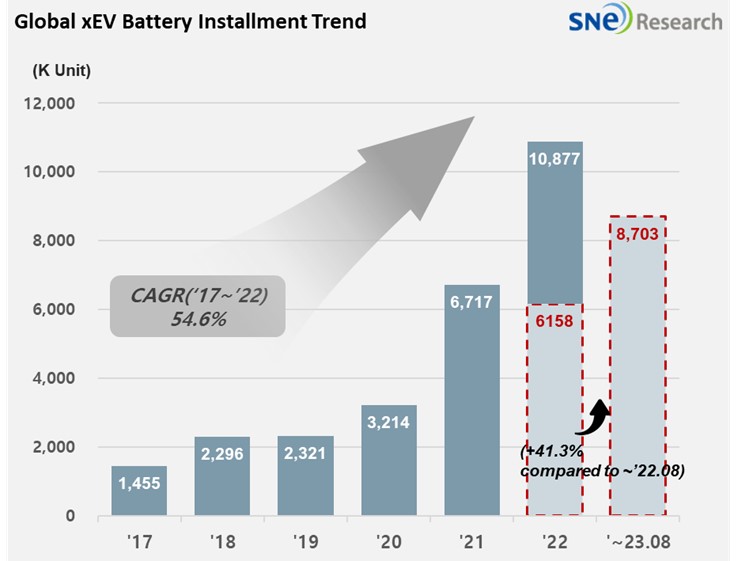
From Jan to August in 2023, Global Electric Vehicle Deliveries Posted 8.703 Mil Units, a 41.3% YoY Growth
2023.10.12
Read news articles carefully picked by our professional analysts and get the most up-to-date market insight.
New Press
Battery, Battery Materials, EV
From Jan to May in 2025, Global Electric Vehicle Battery Electrolyte Installment Reached 488K ton, a 46.3% YoY Growth
From Jan to May in
2025, Global[1]
Electric Vehicle Battery Electrolyte Installment[2] Reached
488K ton, a 46.3% YoY Growth
From Jan to May in
2025, the electrolyte market continued to post a double-digit growth, while the
non-China market showed a stable expansion in demand(Source: 2025 June Global EV & Battery Monthly Tracker (Incl. LiB 4 Major Materials), SNE Research) From Jan to May in 2025, the total installment of electrolyte used in electric vehicles (EV, PHEV, HEV) regi
2025.07.10
Battery, Battery Materials, EV
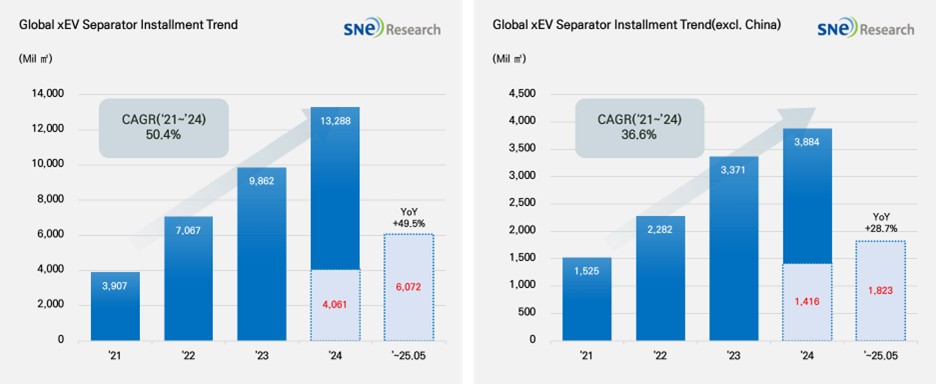
From Jan to May in 2025, Global Electric Vehicle Separator Installment Reached 6,072Mil ㎡, a 49.5% YoY Growth
From Jan to May in 2025, Global[1] Electric
Vehicle Separator Installment[2]
Reached 6,072Mil ㎡, a 49.5% YoY
Growth
- From Jan to May in 2025, the global
separator market posted a steady growth due to the increasing installment of
batteries in electric vehicles.(Source: 2025 June Global EV & Battery Monthly Tracker (Incl. LiB 4 Major Materials), SNE Research) From Jan to May in 2025, the total installment of separators used in electric vehicle (EV, PHEV, HEV) registered worldw
2025.07.09
Battery, Battery Materials, EV
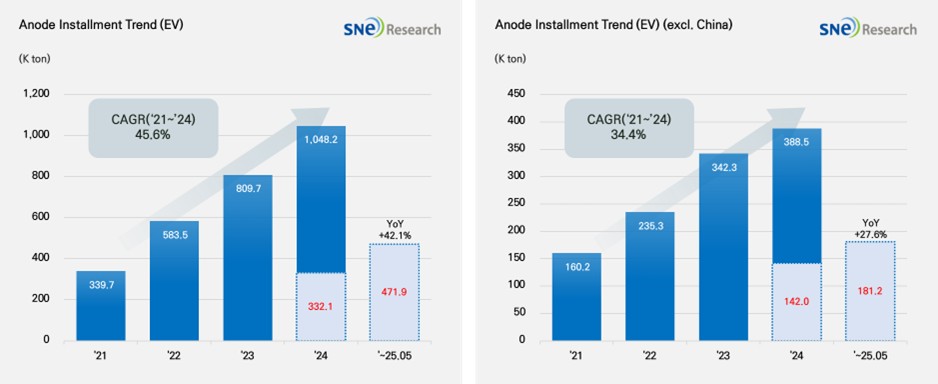
From Jan to May in 2025, Global Electric Vehicle Battery Anode Material Installment Reached 471.9K ton
From Jan to May
in 2025, Global[1] Electric
Vehicle Battery Anode Material Installment[2]
Reached 471.9K ton, a 42.1% YoY Growth
- The non-China
market recorded 181.2K ton, posting a 27.6% growth(Source: 2025 June Global EV & Battery Monthly Tracker (Incl. LiB 4 Major Materials), SNE Research) From Jan to May in 2025, the total installment of anode materials used in electric vehicles (EV, PHEV, HEV) registered worldwide was approx. 471.9K ton, posting a 42.1% YoY increase and mai
2025.07.08
Battery, Battery Materials, EV
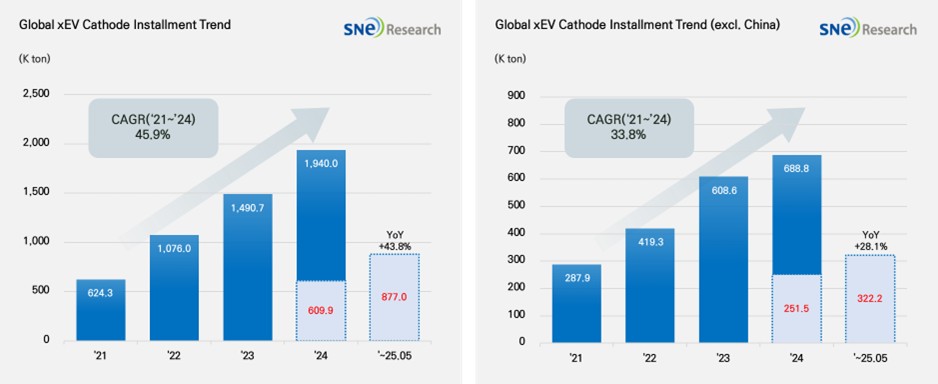
From Jan to May in 2025, Global Electric Vehicle Battery Cathode Material Installment Reached 877.0K ton
From Jan to May in 2025, Global[1] Electric
Vehicle Battery Cathode Material Installment[2]
Reached 877.0K ton, a 43.8% YoY Growth
- From Jan to May in 2025, EV battery cathode material
installment in non-China market was 322.2K ton, posting 28.1% growth(Source: 2025 June Global EV & Battery Monthly Tracker (Incl. LiB 4 Major Materials), SNE Research) From Jan to May in 2025, the total installment of cathode materials used in electric vehicles (EV, PHEV, HEV) registered worldwide
2025.07.07
Battery, EV
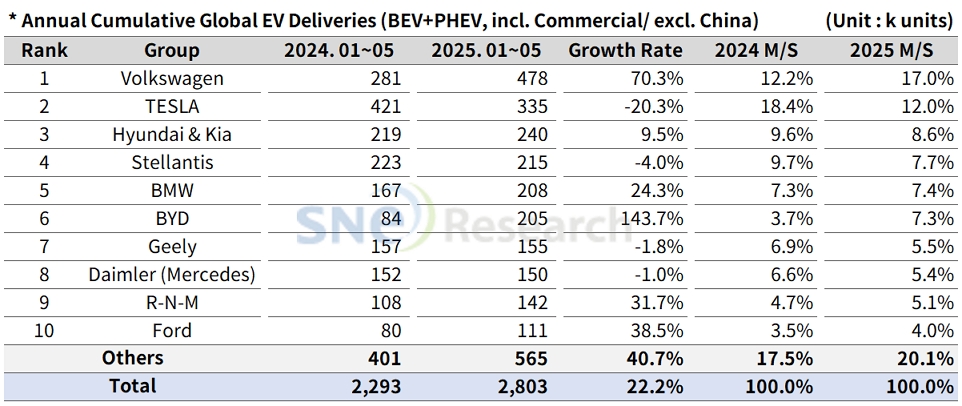
From Jan to May in 2025, Non-China Global Electric Vehicle Deliveries Recorded About 2.803 Mil Units, a 22.2% YoY Growth
From Jan
to May in 2025, Non-China Global[1]
Electric Vehicle Deliveries[2]
Recorded About 2.803 Mil Units, a 22.2% YoY Growth- Tesla ranked 2nd; VW
took No. 1 position with a 70% YoY growth
From Jan to May in 2025, the total number of electric vehicles registered in countries around the
world except China was approx. 2.803 million
units, a 22.2% YoY increase. (Source: Global EV & Battery Monthly Tracker – June 2025, SNE Research) By group, Volkswagen Group o
2025.07.07