

Global EV Sales Reach 13.73 Million Units in January-August 2026, Up 5.9% Year-on-Year
Strong growth in Europe and Asia (ex-China) against declines in China and North America widened the regional gap
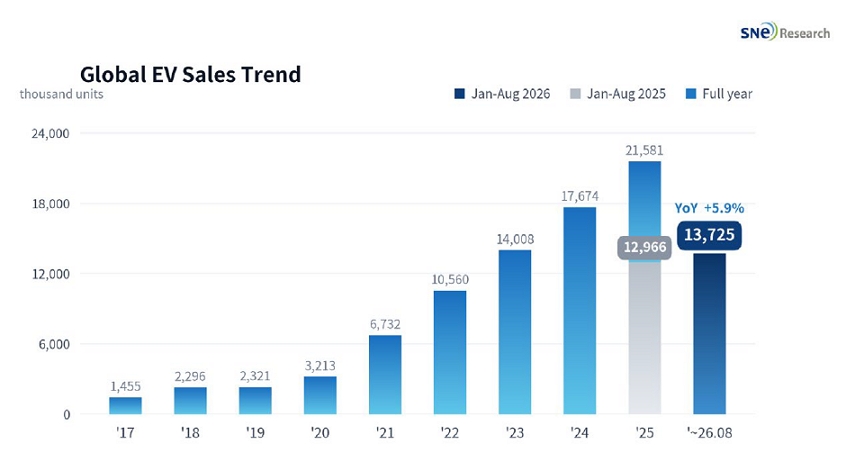
(Source: Global EV and Battery Monthly Tracker, September 2026, SNE Research)
Global EV (BEV+PHEV) sales totaled 13.73 million units in January-August 2026, up 5.9% year-on-year. Sales in the single month of August were 1.858 million units, up only 1.8%, a sharp slowdown from July (11.3%). By type, BEVs rose 13.5% to 9.876 million units while PHEVs fell 9.8% to 3.849 million units, lifting the BEV share from 67.1% to 72.0%. The market excluding China grew 28.9% to 6.223 million units, a growth rate close to five times that of the global market.
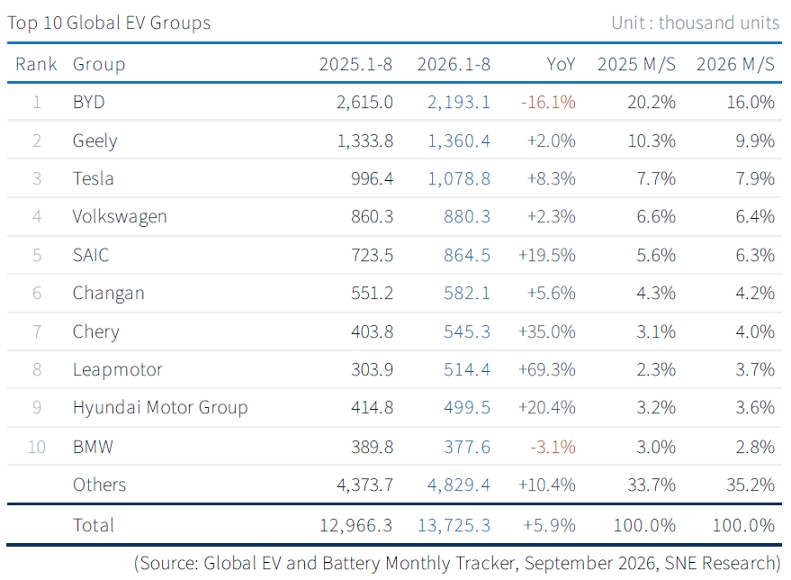
By group, BYD kept the lead with 2.193 million units but fell 16.1% year-on-year, and its share declined 4.2 percentage points from 20.2% to 16.0%. A 33.6% drop in its deliveries in China weighed heavily. By contrast, deliveries in Europe rose 76.5% and in Asia (ex-China) 54.7%, and overseas sales reached a monthly record in August, so export growth narrowed the decline.
Geely held second place with 1.360 million units, up 2.0%, and Tesla rose to third with 1.079 million units, up 8.3%. Tesla's deliveries fell 12.4% in China and 1.5% in North America but rose 21.9% in Europe and 87.2% in Asia (ex-China), lifting its share from 7.7% to 7.9%. Volkswagen grew 2.3% to 880,000 units, but trailed the market average and its share slipped from 6.6% to 6.4%.
Among Chinese OEMs, SAIC rose 19.5% to 864,000 units and Changan 5.6% to 582,000 units. Chery grew 35.0% to 545,000 units, with deliveries in Europe reaching 4.6 times the previous year's level as its export brands continued to expand. Hyundai Motor Group increased 20.4% to 499,000 units, raising its share from 3.2% to 3.6%. North American deliveries fell 23.4%, but growth of 18.5% in Europe and 75.5% in Asia (ex-China) made up for the decline.
Leapmotor posted the highest growth among the top 10 groups, surging 69.3% to 514,000 units. Its share expanded 1.4 percentage points from 2.3% to 3.7%, overtaking Hyundai Motor Group for eighth place. Deliveries in China rose 48.2%, and sales in Europe through the Stellantis distribution network grew to 5.5 times the previous year's level. BMW, on the other hand, fell 3.1% to 378,000 units and remained in tenth place.
Deliveries by groups outside the top 10 rose 10.4% to 4.829 million units, and their share increased 1.5 percentage points from 33.7% to 35.2%. With 11th-placed Toyota growing 58.2% and 14th-placed NIO 57.3%, mid-ranked companies are expanding faster and gradually closing the distance to the leaders.
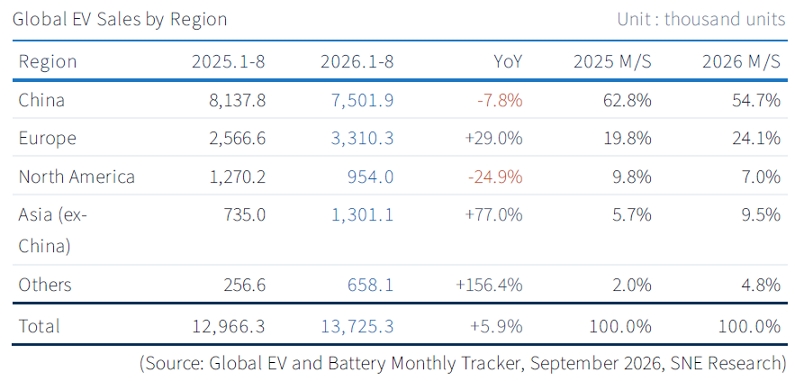
By region, China remained the largest market with 7.502 million units but fell 7.8%, and its share contracted 8.1 percentage points from 62.8% to 54.7%. BEVs rose 1.0%, but PHEVs fell 23.3% and led the decline. With domestic sales declining since the start of the year amid a smaller purchase tax exemption and price competition, Chinese manufacturers are turning to exports for growth.
Europe grew 29.0% to 3.310 million units, raising its share from 19.8% to 24.1%. BEVs rose 33.2% and PHEVs 20.3%, with both types growing evenly. National support measures, including Germany's reintroduction of purchase subsidies for low-income households, and the launch of affordable new models lifted demand, while the sales expansion of Chinese brands also stood out.
North America fell 24.9% to 954,000 units, the weakest performance among major regions, and its share dropped 2.8 percentage points from 9.8% to 7.0%. The decline widened to 40.4% in the single month of August, reflecting a base effect from August of last year, when purchases surged ahead of the end of the tax credit. With a demand vacuum lasting nearly a year since the U.S. EV tax credit ended at the end of September last year, some automakers are adjusting their plans by cutting EV production and converting battery plants to ESS.
Asia (ex-China) grew 77.0% to 1.301 million units, and its share expanded 3.8 percentage points from 5.7% to 9.5%. Major markets grew across the board, including Korea (81.3%), India (56.8%), Thailand (73.8%), Vietnam (76.3%) and Indonesia (102.4%). Other regions also rose 156.4% to 658,000 units, lifting their share from 2.0% to 4.8%, led by Brazil (148.0%) and Australia (135.8%).
In sum, the global EV market grew by only a single digit in January-August 2026, with clear contrasts between regions and companies. China and North America contracted at the same time, but Europe, Asia (ex-China) and emerging markets filled the gap, and Leapmotor, Chery, SAIC and Hyundai Motor Group raised their shares with double-digit growth. Market leader BYD, by contrast, saw its share fall 4.2 percentage points as the decline in its domestic sales outweighed strong overseas sales.
Through the end of the year, the direction of the market will depend on whether domestic demand in China recovers, how long the U.S. policy vacuum lasts, and whether growth in Europe continues. With China having started to levy a 2% consumption tax on lithium-ion batteries in September and set to abolish the export VAT rebate on batteries from January next year, higher battery costs could be passed on to vehicle prices. As overseas sales of Chinese OEMs rise rapidly, the focus of competition is shifting to local production bases, the ability to supply affordable models and responsiveness to regional regulations, and these factors are expected to drive changes in market share through the end of the year.