

Global EV Sales Reach 11.80 Million Units in January-July 2026, Up 6.3% Year-on-Year
Europe and Asia (ex-China) drove growth, while China and North America both declined
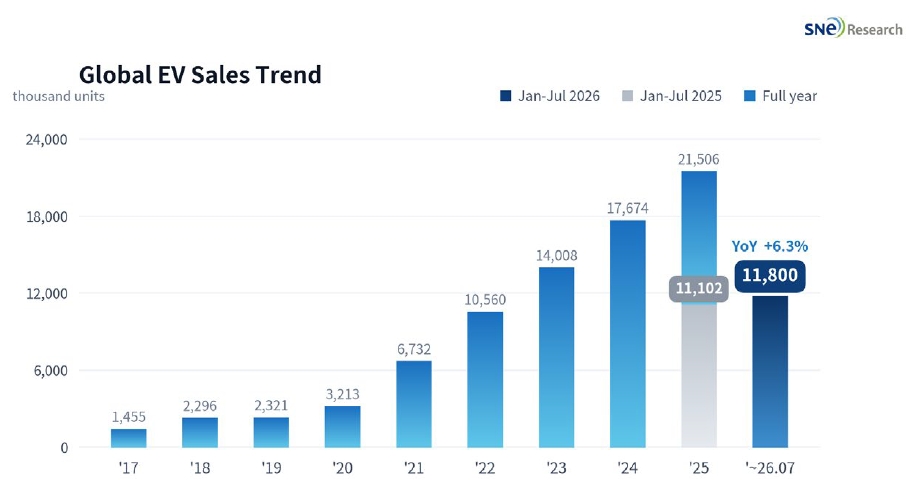
(Source: Global EV and Battery Monthly Tracker, August 2026, SNE Research)
Global EV (BEV+PHEV) sales totaled 11.80 million units in January-July 2026, up 6.3% year-on-year. The market sustained a moderate expansion, but the gap between regional trends widened further. High growth in Europe, Asia (ex-China), and other emerging markets offset the declines in China and North America, making the shift of demand's center of gravity outside China increasingly clear. Indeed, the ex-China market grew 30.5% to 5.434 million units, far outpacing the growth rate of the overall market.
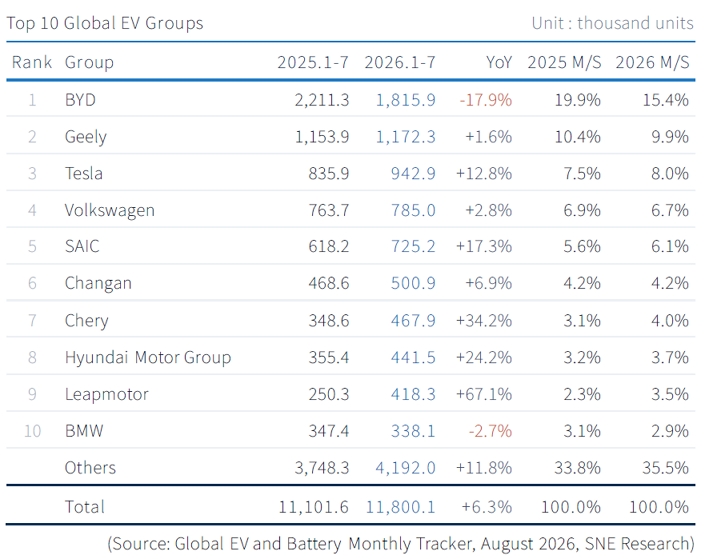
In global EV sales by group for January-July 2026, BYD held the lead with 1.816 million units but fell 17.9% year-on-year. Its share also declined 4.5 percentage points from 19.9% to 15.4%. While weak domestic demand in China weighed on its cumulative performance, expanded overseas sales centered on Europe, Southeast Asia, and Latin America are assessed to have limited the extent of the decline.
Geely held second place with 1.172 million units, up 1.6%, and Tesla ranked third with 943,000 units, up 12.8%. Tesla's share rose from 7.5% to 8.0%. Volkswagen posted 785,000 units, up 2.8%, but as this trailed the market average its share edged down from 6.9% to 6.7%. The company continued to benefit from expanding BEV demand in Europe, but the rapid overseas expansion of Chinese OEMs is further narrowing the competition at the top of the rankings.
Among major Chinese OEMs, SAIC rose 17.3% to 725,000 units and Changan rose 6.9% to 501,000 units. Chery grew 34.2% to 468,000 units, sustaining the effect of its expanding export brands. Hyundai Motor Group increased 24.2% to 442,000 units, recording a high growth rate among the top-ranked groups, and its share rose from 3.2% to 3.7%. A recovery in European sales and expanding demand in Asia (ex-China) are seen as having underpinned the improvement in performance.
Leapmotor surged 67.1% to 418,000 units, the highest growth rate among the top 10 groups, and its share expanded from 2.3% to 3.5%. Overseas expansion leveraging the Stellantis distribution network and a broader product lineup appear to have accelerated its growth. By contrast, BMW fell 2.7% to 338,000 units and remained in tenth place.
Sales by companies outside the top 10 groups rose 11.8% to 4.192 million units, and their share climbed 1.7 percentage points from 33.8% to 35.5%. While some of the leading players faltered, regionally specialized OEMs and emerging brands rapidly expanded in scale, continuing the diversification of the competitive landscape.
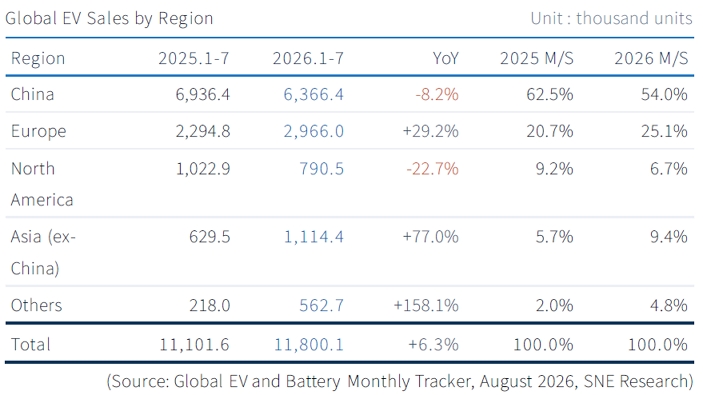
By region, China retained its position as the largest market with 6.366 million units but fell 8.2% year-on-year. Its share also contracted 8.5 percentage points from 62.5% to 54.0%. With the reduced EV purchase tax exemption in 2026 and intensifying price competition weighing on demand, retail sales of new energy vehicles in China continued to decline year-on-year in July as well, extending the adjustment phase.
Europe grew 29.2% to 2.966 million units, lifting its share from 20.7% to 25.1%. Responses to strengthened emissions regulations, the introduction of affordable new models, and incentives in individual countries supported demand. ACEA figures also showed the BEV share of EU passenger cars expanding to 20.7% in the first half, indicating that the shift to electrification is spreading across the market as a whole.
North America fell 22.7% to 790,000 units, the weakest performance among the major regions, and its share fell from 9.2% to 6.7%. Following the expiration of the U.S. tax credits for new, used, and commercial clean vehicles at the end of September 2025, the purchase burden has grown, and combined with high vehicle prices and the effects of model replacement cycles, the recovery in demand is being delayed.
Asia (ex-China) grew 77.0% to 1.114 million units, and its share expanded from 5.7% to 9.4%. In Korea, India, and Southeast Asia, new model launches, local production, and adoption policies worked in concert, establishing the region as the fastest-growing axis. Other regions also surged 158.1% to 563,000 units, raising their share from 2.0% to 4.8%, as the early expansion of adoption in emerging markets such as Latin America and the Middle East lifted the overall growth rate.
The global EV market grew 6.3% in January-July 2026, but differences in performance by region and by company widened further. Despite the adjustment in China and North America, Europe, Asia (ex-China), and other regions generated new demand, and Leapmotor, Chery, Hyundai Motor Group, and Tesla raised their shares with double-digit growth. By contrast, BYD was significantly affected by the slowdown in the Chinese market, with its share falling 4.5 percentage points, signaling a change in the makeup of the leading group.
In the second half, the extent of the adjustment in Chinese demand, whether the gap left by the U.S. tax credits persists, and the continuity of Europe's growth are expected to determine the market's direction. As overseas sales by Chinese OEMs are rising rapidly, the axis of competition is also broadening from simple sales volume to local production bases, price competitiveness, charging infrastructure, and supply chain response capabilities. Accordingly, each OEM's pace of localization and its ability to supply affordable models are expected to be the key variables in share changes during the second half.