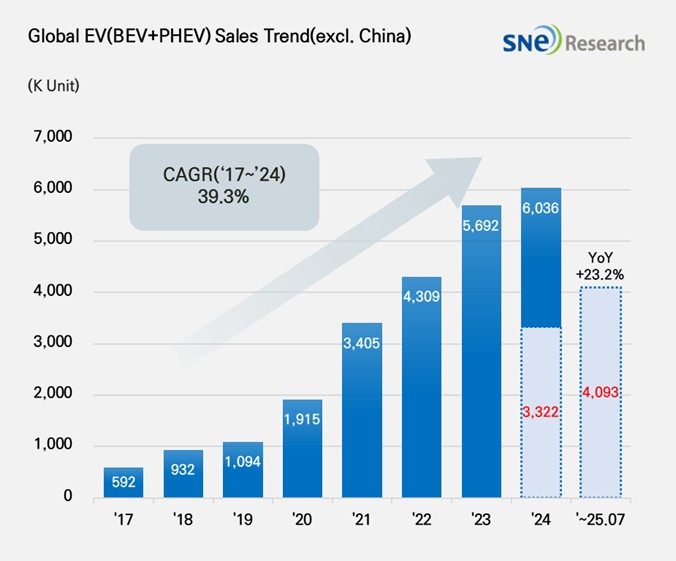
From Jan to July in 2025, Non-China Global[1] Electric Vehicle Deliveries[2] Recorded About 4.093 Mil Units, a 23.2% YoY Growth
- VW took top position with 694k
units…Tesla ranked 2nd with 16.4% degrowth
From Jan to July in 2025, the total number of electric
vehicles registered in
countries around the world except China was approx. 4.093 million units, a 23.2% YoY increase.

(Source: Global EV & Battery Monthly Tracker – Aug 2025, SNE Research)
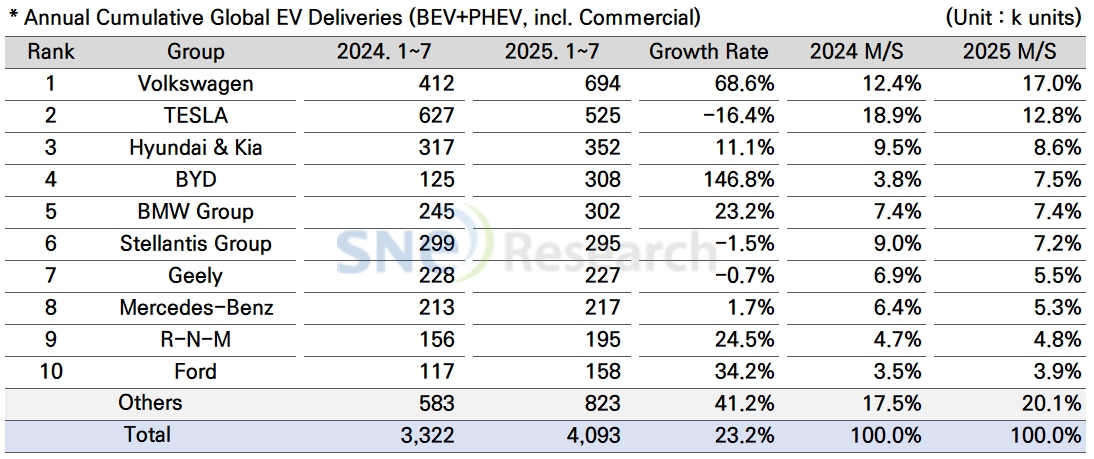
By group, Volkswagen Group took No. 1 position in the ranking of global electric vehicle deliveries, excluding China, by selling 694k units and posting a 68.6% YoY increase. Major models such as ID.4, ID.7, and ENYAQ, built on the MEB platform, enjoyed strong sales momentum in the European market. Increasing sales of new vehicles, such as A6/Q6 e-Tron, and Macan 4 Electric, to which the PPE platform is applied, are regarded as a drive behind such rapid growth of VW Group.
Even though Tesla ranked 2nd on the list by delivering 525k units, it saw a 16.4% YoY decrease, seriously affected by a slowdown in demand. Deliveries of Model Y and 3 have been reduced by 11.0% and 19.7% respectively, becoming a major reason for the overall sales decline. Sales of premium sedans – Model S and Model X – also decreased by 62.2% and 48.8% respectively, meaning that Tesla’s competitiveness in the premium segment obviously weakened. 13k units of Cybertruck were delivered to customers, but compared to the same period last year, sales were 17.4% lowered. It seems Cybertruck has not made a meaningful contribution to recovery of overall sales yet.
Hyundai Motor Group in the 3rd place sold approx. 352k units, posting a 11.1% YoY increase. In addition to steady demand for IONIQ 5 and EV 6, expanding sales of EV 3 and Casper (Inster) EV have led the growth in sales. In particular, EV 3 is received well in the markets of Europe and emerging countries in Asia, while Casper EV is contributing to expansion of sales by absorbing a new demand for electric vehicles befitting urban commuting and driving.

(Source: Global EV & Battery Monthly Tracker – Aug 2025, SNE Research)
By region, Europe posted a 29.7% YoY growth with 2.260 million units of electric vehicles sold. The market held by Europe from Jan to July was 55.2%, a slight increase from the same period last year. %. Although a recovery in the market continued in terms of figures, in the European market, customers has been increasingly sensitive to car prices, which led to the expansion of marker shares held by the Chinese electric vehicles other than the existing car brands. Chinse OEMs such as BYD, NIO, and Xpeng are working in earnest to build local production sites in Hungary and Spain. In this regard, conflicts have become visible between the EU policy to promote local production and measures to curb Chinese electric vehicles. These structural shifts would be evaluated later depending on whether OEMs in Europe would later secure their own price competitiveness or not.
The North American market recorded only a 0.3% YoY growth with 1.011 million units sold, accounting for 24.7% of the non-China EV market. While major manufacturers such as GM, Ford, and Hyundai Motor Group have been trying to increase their local production in North America based on tax credit benefits under the US IRA, demand for electric vehicles in the market remained below expectation. As the Trump Administration has been pushing forward with tax cuts and easing of environmental regulations, the federal government is now considering reducing subsidies offered for electric vehicles. Under these circumstances, an outlook for electric vehicle demand seems to be adjusted downward, and OEMs are trying to modify their strategies, placing more emphasis on internal combustion engine vehicles.
The Asia market (excluding China) exhibited a 45.5% YoY growth with 610k units sold, taking up 14.9% of market share. In the emerging markets, mainly led by India, demand for electric vehicles, of which price range is from US$ 10k to 20k, has been rising. Japan is also signaling a full-fledged shift toward battery electric vehicles (BEVs), led by Toyota and Honda. However, disparities in charging infrastructure and consumer subsidies across countries continue to result in significant differences in the pace of growth by region.
In other regions (Middle East, South America, Oceania, etc.), sales of electric vehicles were 213k units, posting a 40.0% YoY increase and accounting for 5.2% of market share. Global OEMs are taking these regions as new growth bases in an effort to expand their EV line-ups, but facing a high barrier in terms of price, infrastructure, and policy.

(Source: Global EV & Battery Monthly Tracker – Aug 2025, SNE Research)
In 2025, the global EV market outside of China is increasingly characterized by a restructuring of competitive dynamics and a stronger emphasis on technology-driven differentiation strategies. In Europe, performance gaps among OEMs are widening depending on new model launch cycles and the level of platform advancement, while maintaining brand value and defending profitability have become key challenges amid the spread of low-cost models. In North America, despite sluggish sales, the strengthening of local battery sourcing and the establishment of domestic production bases are emerging as strategic factors that will determine long-term competitiveness through supply chain localization. Meanwhile, emerging Asian markets are rising as core growth regions, supported by government-led promotion policies and strong demand for EVs at affordable price points. Global automakers are responding by pursuing technological independence, redefining product positioning, and expanding strategic localization in order to secure both profitability and market share simultaneously.
[2] Based on electric vehicles (BEV+PHEV) delivered to customers or registered during the relevant period

