

-
Battery, EV
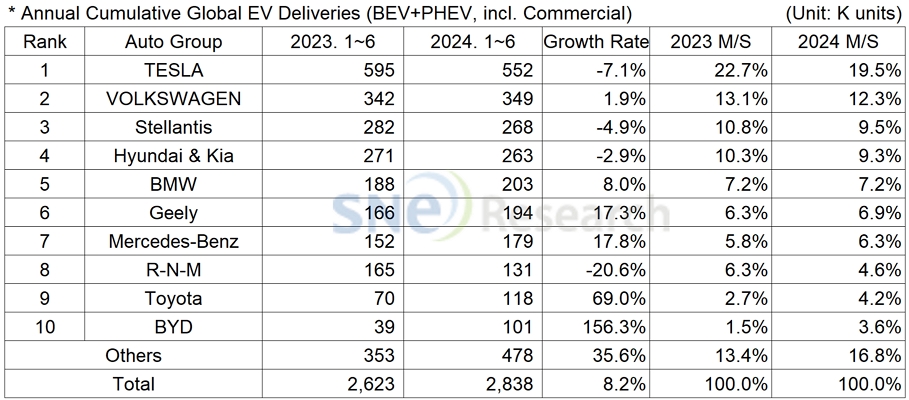
From Jan to June 2024, Non-China Global Electric Vehicle Deliveries Recorded 2.838 Mil Units, a 8.2% YoY Growth
2024.08.12 -
Battery, EV
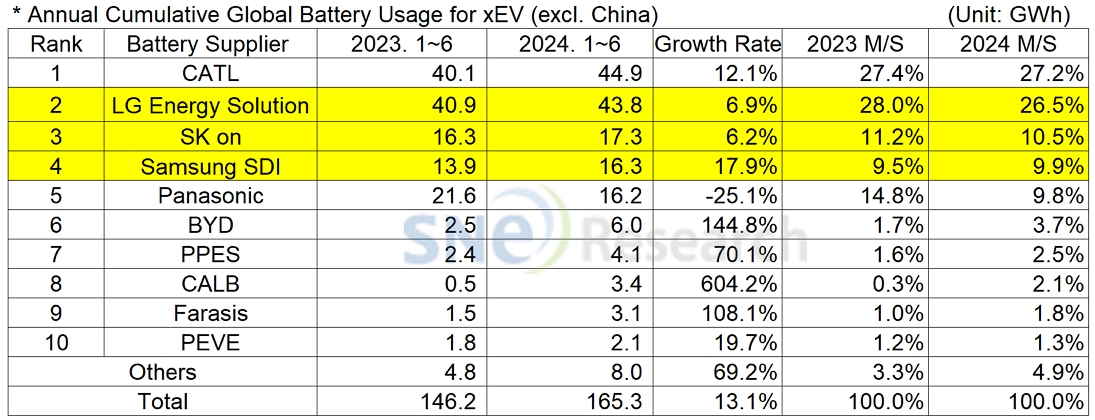
From Jan to June 2024, Non-Chinese Global EV Battery Usage Posted 165.3GWh
2024.08.09 -
Battery, EV
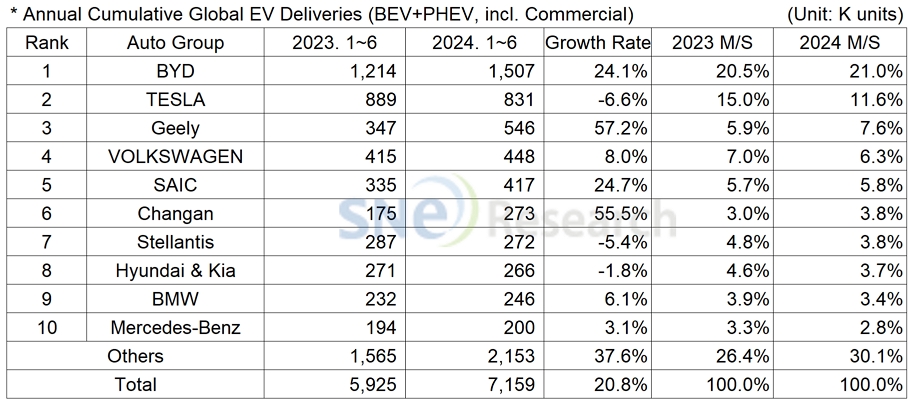
From Jan to June 2024, Global Electric Vehicle Deliveries Posted Approx. 7.159 Mil Unit
2024.08.08 -
Battery, EV
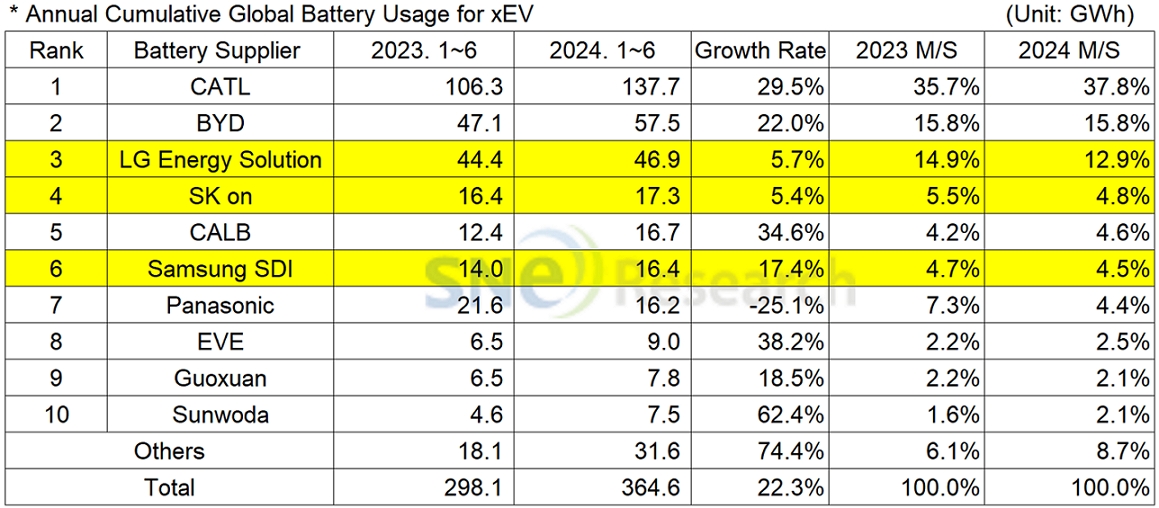
From Jan to June 2024, Global[1] EV Battery Usage[2] Posted 364.6GWh, a 22.3% YoY Growth
2024.08.07 -
Battery, EV
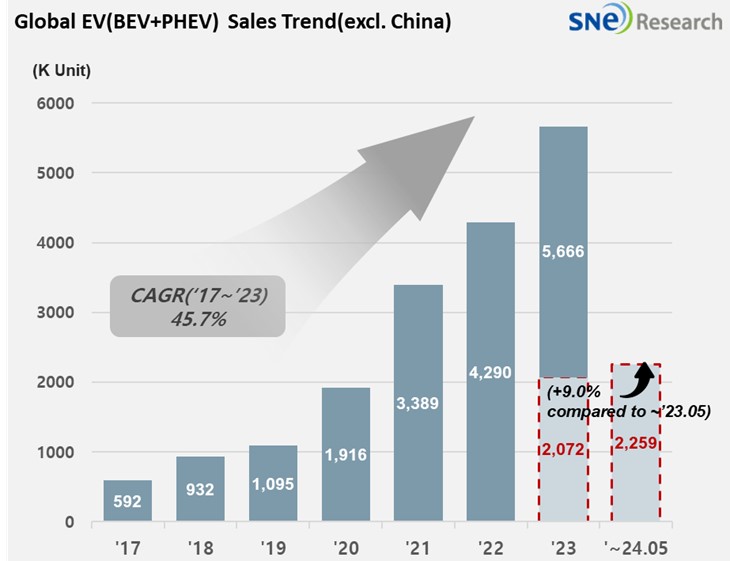
From Jan to May 2024, Non-China Global Electric Vehicle Deliveries Recorded 2.259 Mil Units, a 9.0% YoY Growth
2024.07.08 -
Battery, EV
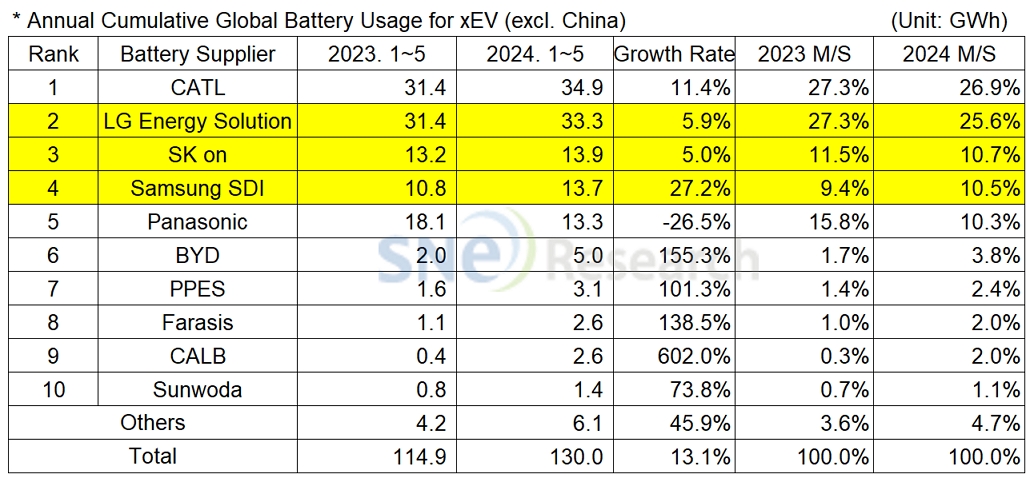
From Jan to May 2024, Non-Chinese Global EV Battery Usage Posted 130.0GWh, a 13.1% YoY Growth
2024.07.05 -
Battery, EV
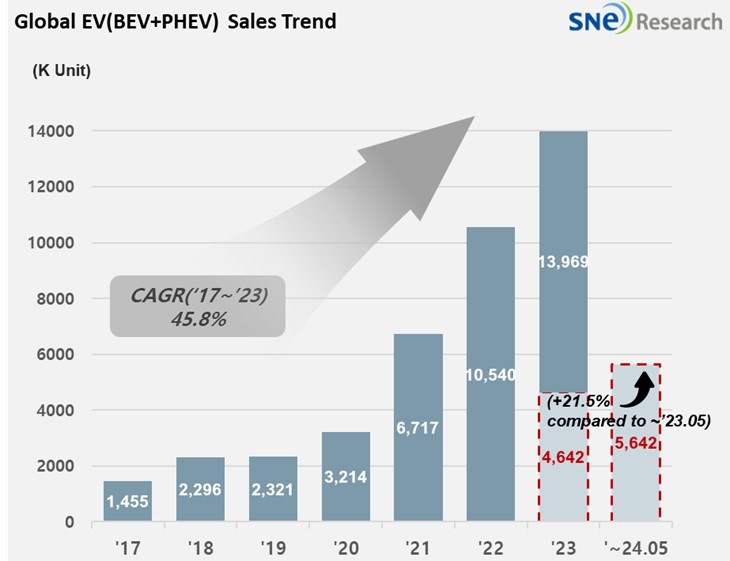
From Jan to May 2024, Global Electric Vehicle Deliveries Posted Approx. 5.642 Mil Units, a 21.5% YoY Growth.
2024.07.04 -
Battery, EV
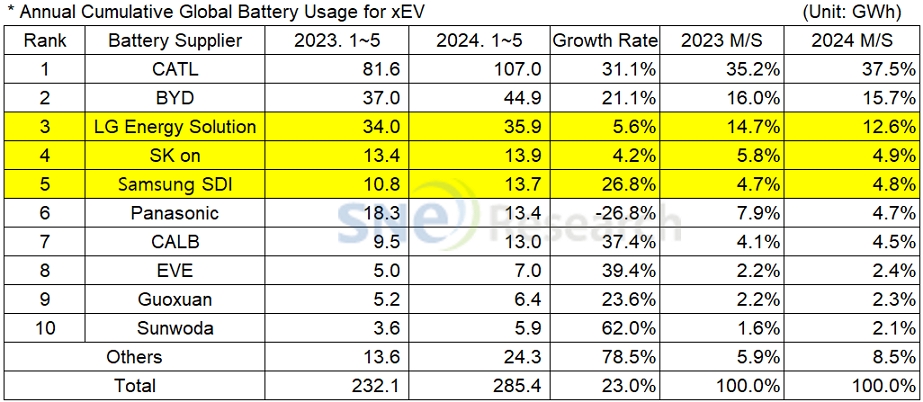
From Jan to May 2024, Global EV Battery Usage Posted 285.4GWh, a 23.0% YoY Growth
2024.07.03 -
Battery
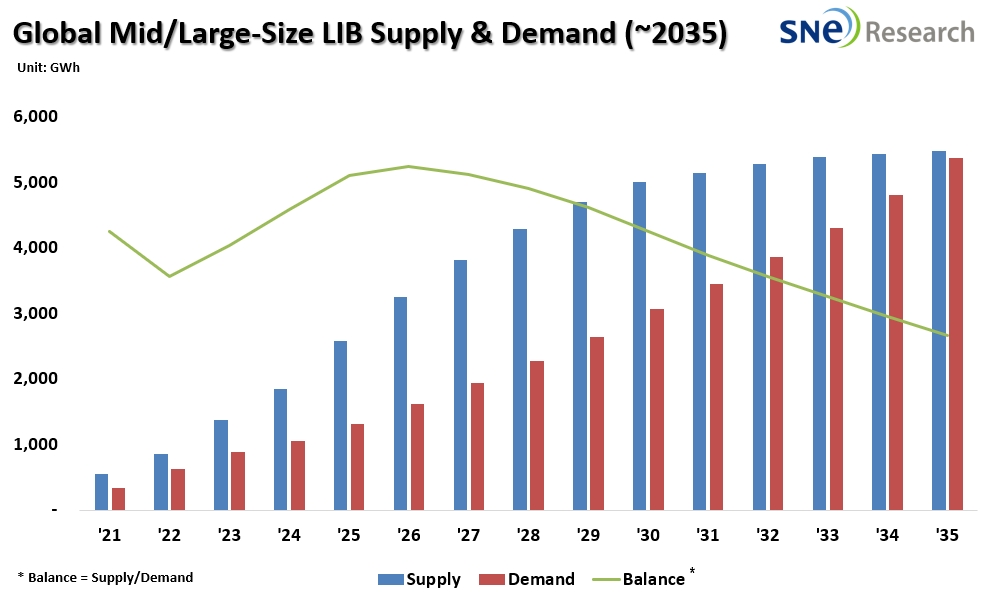
Global LIB Production Capacity Expected to Grow up to 5.7TWh by 2035
2024.06.27 -
Battery, EV
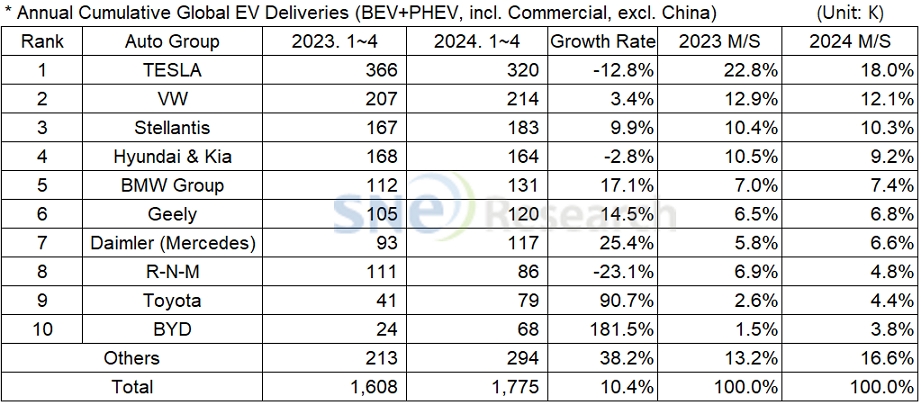
From Jan to Apr 2024, Non-China Global Electric Vehicle Deliveries Recorded 1.775 Mil Units, a 10.4% YoY Growth
2024.06.11 -
Battery, EV
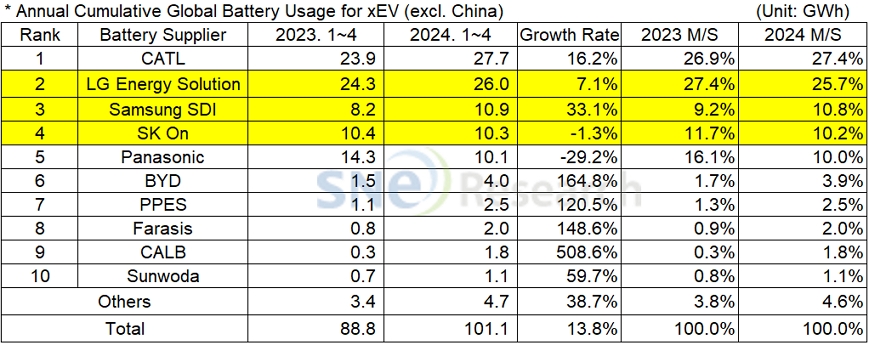
From Jan to Apr 2024, Non-Chinese Global EV Battery Usage Posted 101.1GWh, a 13.8% YoY Growth
2024.06.10 -
Battery, EV
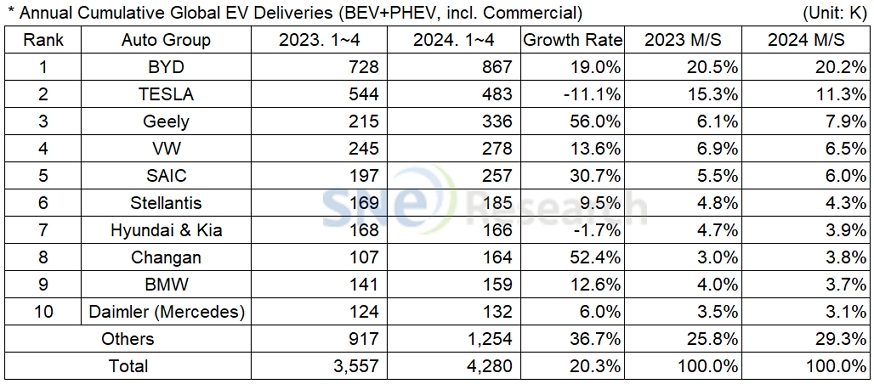
From Jan to Apr 2024, Global Electric Vehicle Deliveries Posted Approx. 4.280 Mil Units
2024.06.07
Read news articles carefully picked by our professional analysts and get the most up-to-date market insight.
New Press
Battery, Battery Materials, EV
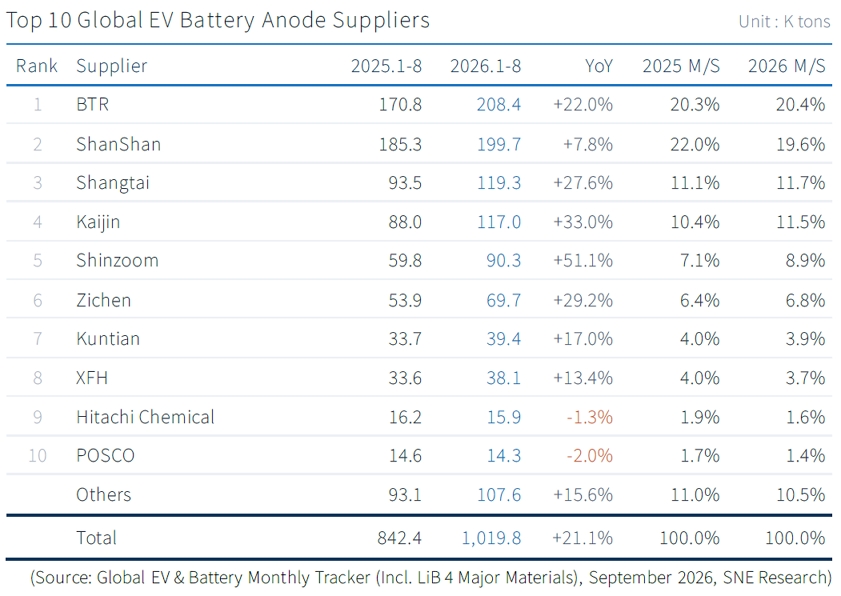
Global EV Battery Anode Material Consumption Reaches 1,020K tons in Jan-Aug 2026, Up 21.1% Year-on-Year NEW
Global EV
Battery Anode Material Consumption Reaches 1,020K tons in Jan-Aug 2026, Up
21.1% Year-on-Year
- Ex-China
market records 402K tons, growing 27.5% and outpacing the global average
Global anode material consumption for electric vehicles reached 1,020K tons in January-August 2026, up 21.1% from 842K tons a year earlier, exceeding 1,000K tons for the first time on a January-August basis. Over the same period, the ex-China market grew 27.5% from 315K tons to 402K tons, 6
2026.10.13
Battery, Battery Materials, EV
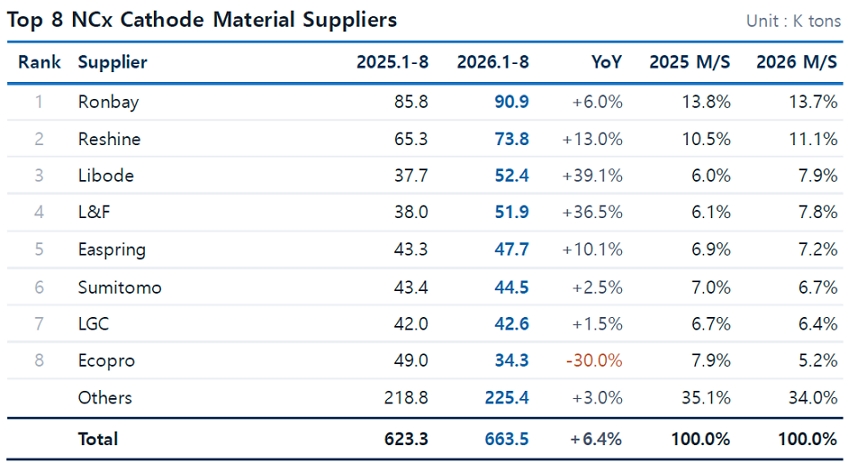
Global EV Battery Cathode Material Consumption Reaches 1,917K tons in Jan-Aug 2026 NEW
Global EV Battery Cathode Material Consumption Reaches 1,917K tons in Jan-Aug 2026, Up 21.8% Year-on-Year- LFP share rises 5.0 percentage points to 65.4%, while the ex-China market grows 30.0% and drives expansion (Source: Global EV & Battery Monthly Tracker (Incl. LiB 4 Major Materials), September 2026, SNE Research) Global cathode material consumption for xEVs reached 1,917K tons in January-August 2026, up 21.8% from 1,575K tons a year earlier. Over the same period, the ex-
2026.10.12
Battery, EV
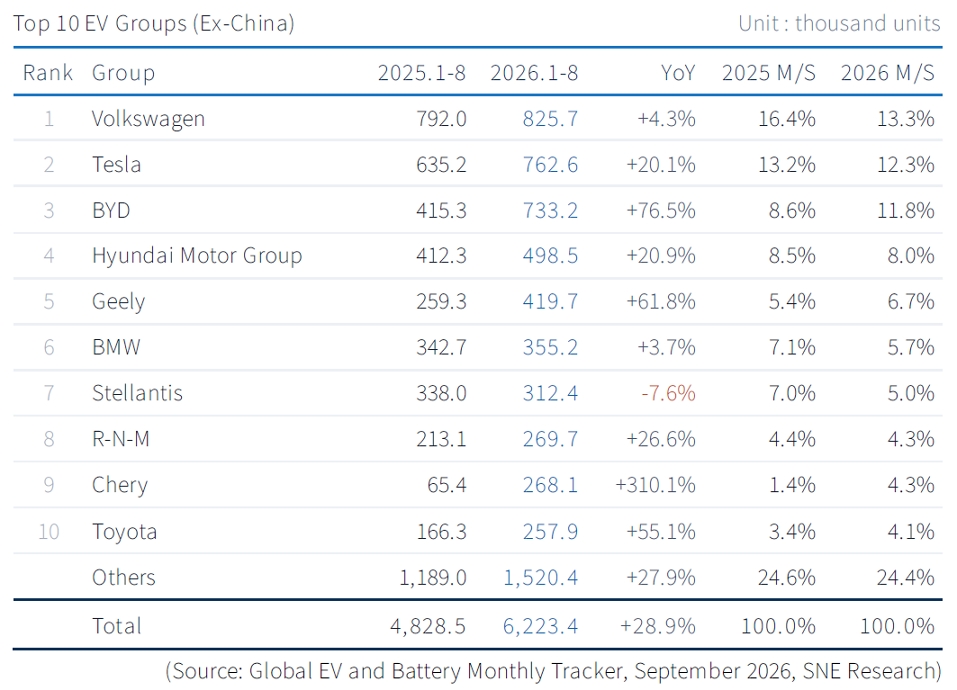
Global EV Sales Excluding China Reach 6.223 Million Units in January-August 2026, Up 28.9% Year-on-Year
Global EV Sales Excluding China Reach 6.223 Million Units in January-August 2026, Up 28.9% Year-on-Year - Asia (ex-China) surges 77.0% while North America falls 24.9%, as regional trends diverge(Source: Global EV and Battery Monthly Tracker, September 2026, SNE Research) In January-August 2026, global EV (BEV+PHEV) sales excluding China totaled 6.223 million units, up 28.9% from 4.829 million units a year earlier. Growth far exceeded the global rate (5.9%), continuing the shift of dema
2026.10.08
Battery, EV
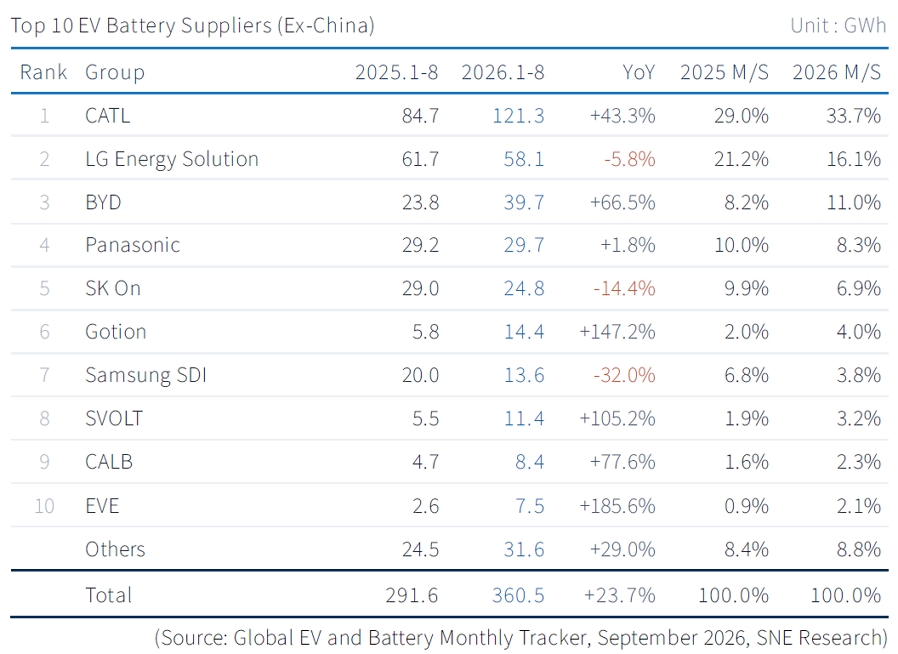
Global (Ex-China) EV Battery Usage in January-August 2026 Reaches 360.5 GWh, Up 23.7% Year-on-Year
Global
(Ex-China) EV Battery Usage[1]
in January-August 2026[2]
Reaches 360.5 GWh, Up 23.7% Year-on-Year
- CATL and BYD's combined
share rose 7.5 percentage points to 44.7%, extending Chinese suppliers' reach
outside China
Total battery usage in electric vehicles (EV, PHEV, HEV) sold in the global market excluding China came to approximately 360.5 GWh in January-August 2026, up 23.7% year-on-year. This was 4.0 percentage points above the global growth rate (19.7%), but
2026.10.07
Battery, EV
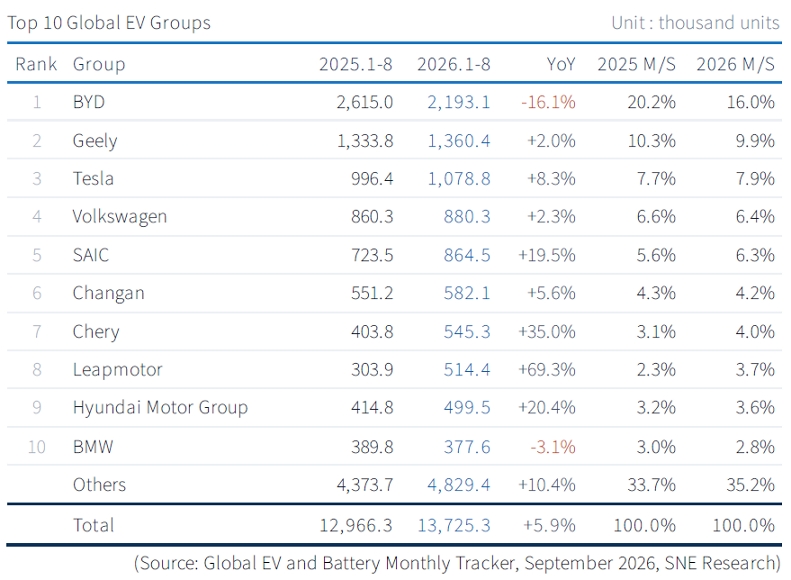
Global EV Sales Reach 13.73 Million Units in January-August 2026, Up 5.9% Year-on-Year
Global
EV Sales Reach 13.73 Million Units in January-August 2026, Up 5.9% Year-on-Year
Strong growth in Europe and
Asia (ex-China) against declines in China and North America widened the
regional gap (Source: Global EV and Battery Monthly Tracker, September 2026, SNE Research) Global EV (BEV+PHEV) sales totaled 13.73 million units in January-August 2026, up 5.9% year-on-year. Sales in the single month of August were 1.858 million units, up only 1.8%, a sharp slowdown from July (1
2026.10.06


